
|
Schwarze Steinmineralien, L. P. (BSM) DCF -Bewertung |
Fully Editable: Tailor To Your Needs In Excel Or Sheets
Professional Design: Trusted, Industry-Standard Templates
Investor-Approved Valuation Models
MAC/PC Compatible, Fully Unlocked
No Expertise Is Needed; Easy To Follow
Black Stone Minerals, L.P. (BSM) Bundle
Möchten Sie den inneren Wert von schwarzen Steinmineralien beurteilen, L.P.? Unser (BSM) DCF-Taschenrechner integriert reale Daten mit umfangreichen Anpassungsfunktionen, sodass Sie Ihre Prognosen verfeinern und Ihre Anlageentscheidung verbessern können.
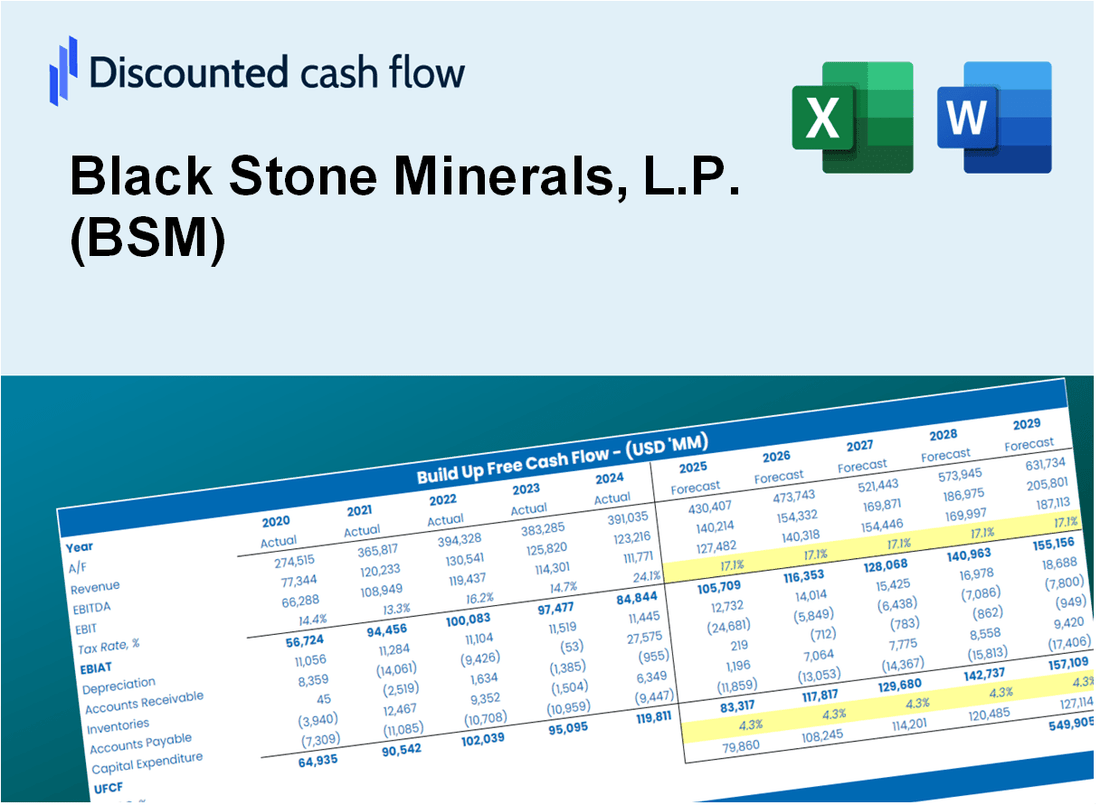
Discounted Cash Flow (DCF) - (USD MM)
| Year | AY1 2020 |
AY2 2021 |
AY3 2022 |
AY4 2023 |
AY5 2024 |
FY1 2025 |
FY2 2026 |
FY3 2027 |
FY4 2028 |
FY5 2029 |
|---|---|---|---|---|---|---|---|---|---|---|
| Revenue | 296.6 | 505.7 | 663.6 | 501.1 | 439.4 | 510.7 | 593.6 | 689.9 | 801.9 | 932.0 |
| Revenue Growth, % | 0 | 70.49 | 31.22 | -24.49 | -12.31 | 16.23 | 16.23 | 16.23 | 16.23 | 16.23 |
| EBITDA | 215.4 | 248.6 | 531.4 | 472.0 | 319.6 | 376.7 | 437.8 | 508.9 | 591.5 | 687.4 |
| EBITDA, % | 72.61 | 49.16 | 80.08 | 94.2 | 72.74 | 73.76 | 73.76 | 73.76 | 73.76 | 73.76 |
| Depreciation | 83.1 | 62.1 | 48.7 | 46.7 | 45.2 | 68.7 | 79.8 | 92.8 | 107.9 | 125.4 |
| Depreciation, % | 28.03 | 12.28 | 7.33 | 9.32 | 10.29 | 13.45 | 13.45 | 13.45 | 13.45 | 13.45 |
| EBIT | 132.2 | 186.6 | 482.8 | 425.3 | 274.4 | 308.0 | 358.0 | 416.1 | 483.6 | 562.1 |
| EBIT, % | 44.57 | 36.89 | 72.75 | 84.87 | 62.45 | 60.31 | 60.31 | 60.31 | 60.31 | 60.31 |
| Total Cash | 1.8 | 8.9 | 4.3 | 70.3 | 2.5 | 18.0 | 20.9 | 24.3 | 28.2 | 32.8 |
| Total Cash, percent | .0 | .0 | .0 | .0 | .0 | .0 | .0 | .0 | .0 | .0 |
| Account Receivables | 61.9 | 97.1 | 135.7 | 82.3 | 71.1 | 95.1 | 110.6 | 128.5 | 149.3 | 173.6 |
| Account Receivables, % | 20.87 | 19.21 | 20.45 | 16.41 | 16.18 | 18.62 | 18.62 | 18.62 | 18.62 | 18.62 |
| Inventories | .0 | .0 | 31.5 | .0 | .0 | 4.8 | 5.6 | 6.5 | 7.6 | 8.8 |
| Inventories, % | 0 | 0 | 4.74 | 0 | 0 | 0.94852 | 0.94852 | 0.94852 | 0.94852 | 0.94852 |
| Accounts Payable | 3.4 | 5.9 | 6.8 | 6.3 | 5.9 | 6.1 | 7.1 | 8.2 | 9.5 | 11.1 |
| Accounts Payable, % | 1.15 | 1.18 | 1.02 | 1.25 | 1.35 | 1.19 | 1.19 | 1.19 | 1.19 | 1.19 |
| Capital Expenditure | -4.8 | -14.6 | -12.6 | -19.8 | -4.2 | -11.6 | -13.4 | -15.6 | -18.2 | -21.1 |
| Capital Expenditure, % | -1.62 | -2.89 | -1.89 | -3.95 | -0.95874 | -2.26 | -2.26 | -2.26 | -2.26 | -2.26 |
| Tax Rate, % | 0 | 0 | 0 | 0 | 0 | 0 | 0 | 0 | 0 | 0 |
| EBITAT | 132.2 | 186.6 | 482.8 | 425.3 | 274.4 | 308.0 | 358.0 | 416.1 | 483.6 | 562.1 |
| Depreciation | ||||||||||
| Changes in Account Receivables | ||||||||||
| Changes in Inventories | ||||||||||
| Changes in Accounts Payable | ||||||||||
| Capital Expenditure | ||||||||||
| UFCF | 152.1 | 201.3 | 449.7 | 536.6 | 326.3 | 336.4 | 409.2 | 475.6 | 552.7 | 642.4 |
| WACC, % | 4.64 | 4.64 | 4.64 | 4.64 | 4.64 | 4.64 | 4.64 | 4.64 | 4.64 | 4.64 |
| PV UFCF | ||||||||||
| SUM PV UFCF | 2,083.3 | |||||||||
| Long Term Growth Rate, % | 2.00 | |||||||||
| Free cash flow (T + 1) | 655 | |||||||||
| Terminal Value | 24,814 | |||||||||
| Present Terminal Value | 19,779 | |||||||||
| Enterprise Value | 21,862 | |||||||||
| Net Debt | 22 | |||||||||
| Equity Value | 21,840 | |||||||||
| Diluted Shares Outstanding, MM | 211 | |||||||||
| Equity Value Per Share | 103.61 |
What You Will Get
- Editable Forecast Inputs: Easily modify assumptions (growth %, margins, WACC) to explore various scenarios.
- Real-World Data: Black Stone Minerals, L.P. (BSM) financial data pre-filled to kickstart your analysis.
- Automatic DCF Outputs: The template computes Net Present Value (NPV) and intrinsic value automatically.
- Customizable and Professional: A sleek Excel model tailored to meet your valuation requirements.
- Built for Analysts and Investors: Perfect for evaluating projections, validating strategies, and enhancing efficiency.
Key Features
- 🔍 Real-Life BSM Financials: Pre-filled historical and projected data for Black Stone Minerals, L.P. (BSM).
- ✏️ Fully Customizable Inputs: Adjust all critical parameters (yellow cells) like WACC, growth %, and tax rates.
- 📊 Professional DCF Valuation: Built-in formulas calculate Black Stone's intrinsic value using the Discounted Cash Flow method.
- ⚡ Instant Results: Visualize Black Stone's valuation instantly after making changes.
- Scenario Analysis: Test and compare outcomes for various financial assumptions side-by-side.
How It Works
- Download: Obtain the pre-formatted Excel file containing Black Stone Minerals, L.P.'s (BSM) financial data.
- Customize: Tailor your forecasts, such as revenue growth, EBITDA %, and WACC to fit your analysis.
- Update Automatically: Watch as the intrinsic value and NPV calculations refresh in real-time.
- Test Scenarios: Develop various projections and instantly compare the results.
- Make Decisions: Utilize the valuation outcomes to inform your investment choices.
Why Choose This Calculator for Black Stone Minerals, L.P. (BSM)?
- User-Friendly Interface: Tailored for both novice users and seasoned professionals.
- Customizable Inputs: Easily adjust parameters to suit your specific analysis needs.
- Real-Time Feedback: Observe immediate changes to Black Stone Minerals’ valuation as you tweak inputs.
- Pre-Configured Data: Comes with Black Stone Minerals’ actual financial metrics for swift evaluations.
- Relied Upon by Experts: Utilized by investors and analysts for making well-informed decisions.
Who Should Use This Product?
- Energy Sector Students: Explore mineral rights and their valuation using real-world data.
- Researchers: Integrate industry-specific models into academic studies or projects.
- Investors: Evaluate your own strategies and assess the performance of Black Stone Minerals, L.P. (BSM).
- Financial Analysts: Enhance your analysis with a ready-to-use, customizable DCF model tailored for mineral investments.
- Landowners: Understand how companies like Black Stone Minerals, L.P. (BSM) assess mineral rights and potential revenue.
What the Template Contains
- Pre-Filled DCF Model: Black Stone Minerals, L.P. (BSM) financial data preloaded for immediate use.
- WACC Calculator: Detailed calculations for Weighted Average Cost of Capital.
- Financial Ratios: Evaluate Black Stone Minerals, L.P. (BSM) profitability, leverage, and efficiency.
- Editable Inputs: Change assumptions such as growth, margins, and CAPEX to fit your scenarios.
- Financial Statements: Annual and quarterly reports to support detailed analysis.
- Interactive Dashboard: Easily visualize key valuation metrics and results.
Disclaimer
All information, articles, and product details provided on this website are for general informational and educational purposes only. We do not claim any ownership over, nor do we intend to infringe upon, any trademarks, copyrights, logos, brand names, or other intellectual property mentioned or depicted on this site. Such intellectual property remains the property of its respective owners, and any references here are made solely for identification or informational purposes, without implying any affiliation, endorsement, or partnership.
We make no representations or warranties, express or implied, regarding the accuracy, completeness, or suitability of any content or products presented. Nothing on this website should be construed as legal, tax, investment, financial, medical, or other professional advice. In addition, no part of this site—including articles or product references—constitutes a solicitation, recommendation, endorsement, advertisement, or offer to buy or sell any securities, franchises, or other financial instruments, particularly in jurisdictions where such activity would be unlawful.
All content is of a general nature and may not address the specific circumstances of any individual or entity. It is not a substitute for professional advice or services. Any actions you take based on the information provided here are strictly at your own risk. You accept full responsibility for any decisions or outcomes arising from your use of this website and agree to release us from any liability in connection with your use of, or reliance upon, the content or products found herein.