
|
Beyond Meat, Inc. (BYnd) DCF -Bewertung |
Fully Editable: Tailor To Your Needs In Excel Or Sheets
Professional Design: Trusted, Industry-Standard Templates
Investor-Approved Valuation Models
MAC/PC Compatible, Fully Unlocked
No Expertise Is Needed; Easy To Follow
Beyond Meat, Inc. (BYND) Bundle
Erforschen Sie die finanziellen Aussichten über Fleisch, Inc. (BYND) mit unserem benutzerfreundlichen DCF-Taschenrechner! Geben Sie Ihre Annahmen in Bezug auf Wachstum, Margen und Kosten ein, um den inneren Wert Beyond Measculat, Inc. (BYND) zu berechnen, und informieren Sie Ihre Investitionsentscheidungen.
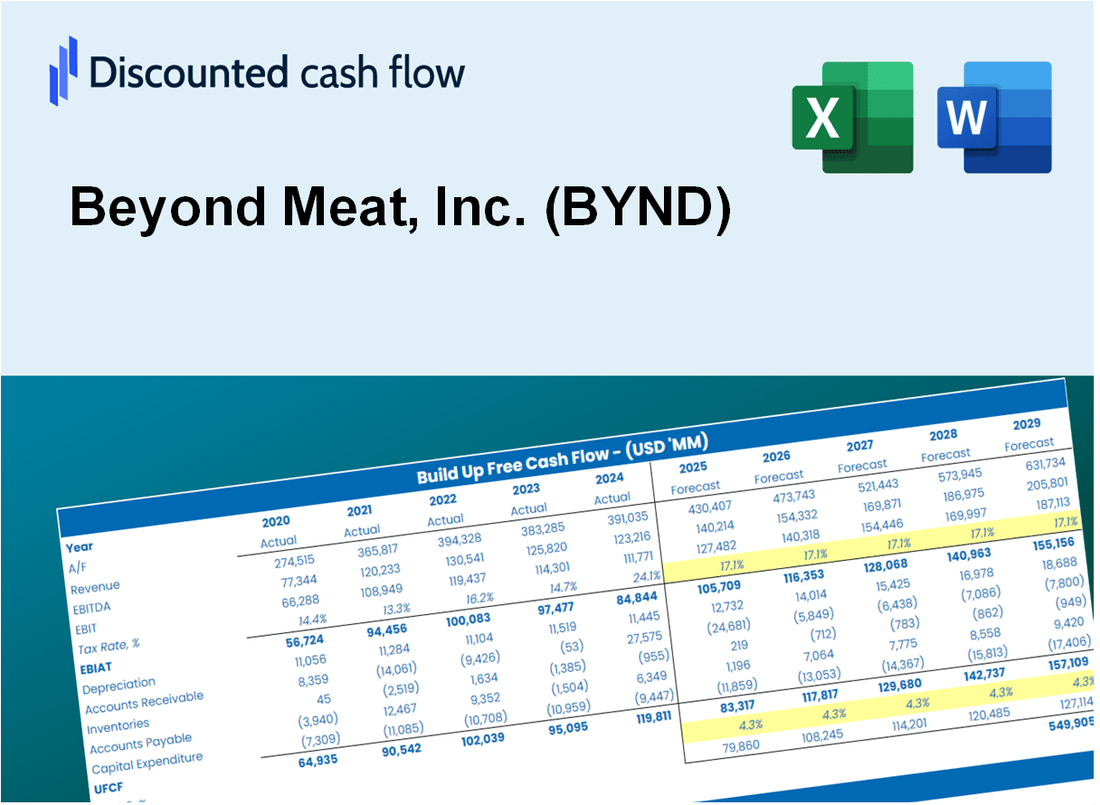
Discounted Cash Flow (DCF) - (USD MM)
| Year | AY1 2020 |
AY2 2021 |
AY3 2022 |
AY4 2023 |
AY5 2024 |
FY1 2025 |
FY2 2026 |
FY3 2027 |
FY4 2028 |
FY5 2029 |
|---|---|---|---|---|---|---|---|---|---|---|
| Revenue | 406.8 | 464.7 | 418.9 | 343.4 | 326.5 | 311.3 | 296.8 | 283.1 | 269.9 | 257.4 |
| Revenue Growth, % | 0 | 14.24 | -9.85 | -18.04 | -4.93 | -4.64 | -4.64 | -4.64 | -4.64 | -4.64 |
| EBITDA | -29.6 | -137.5 | -292.9 | -205.5 | -125.5 | -127.7 | -121.8 | -116.1 | -110.7 | -105.6 |
| EBITDA, % | -7.28 | -29.58 | -69.92 | -59.86 | -38.44 | -41.02 | -41.02 | -41.02 | -41.02 | -41.02 |
| Depreciation | 13.3 | 21.7 | 32.6 | 48.1 | 23.1 | 22.9 | 21.8 | 20.8 | 19.9 | 18.9 |
| Depreciation, % | 3.27 | 4.66 | 7.78 | 14.01 | 7.08 | 7.36 | 7.36 | 7.36 | 7.36 | 7.36 |
| EBIT | -42.9 | -159.1 | -325.5 | -253.6 | -148.6 | -150.6 | -143.6 | -136.9 | -130.6 | -124.5 |
| EBIT, % | -10.55 | -34.25 | -77.7 | -73.86 | -45.53 | -48.38 | -48.38 | -48.38 | -48.38 | -48.38 |
| Total Cash | 159.1 | 733.3 | 309.9 | 190.5 | 131.9 | 192.4 | 183.4 | 174.9 | 166.8 | 159.0 |
| Total Cash, percent | .0 | .0 | .0 | .0 | .0 | .0 | .0 | .0 | .0 | .0 |
| Account Receivables | 36.0 | 43.8 | 34.2 | 31.7 | 26.9 | 27.3 | 26.1 | 24.9 | 23.7 | 22.6 |
| Account Receivables, % | 8.84 | 9.43 | 8.16 | 9.24 | 8.23 | 8.78 | 8.78 | 8.78 | 8.78 | 8.78 |
| Inventories | 121.7 | 241.9 | 235.7 | 130.3 | 113.4 | 131.3 | 125.2 | 119.4 | 113.9 | 108.6 |
| Inventories, % | 29.92 | 52.05 | 56.26 | 37.96 | 34.75 | 42.19 | 42.19 | 42.19 | 42.19 | 42.19 |
| Accounts Payable | 53.1 | 69.0 | 55.3 | 56.0 | 37.6 | 42.9 | 40.9 | 39.0 | 37.2 | 35.5 |
| Accounts Payable, % | 13.05 | 14.86 | 13.2 | 16.32 | 11.51 | 13.79 | 13.79 | 13.79 | 13.79 | 13.79 |
| Capital Expenditure | -60.0 | -136.0 | -73.3 | -10.6 | -11.0 | -42.3 | -40.3 | -38.5 | -36.7 | -35.0 |
| Capital Expenditure, % | -14.75 | -29.26 | -17.5 | -3.08 | -3.37 | -13.59 | -13.59 | -13.59 | -13.59 | -13.59 |
| Tax Rate, % | -0.01622382 | -0.01622382 | -0.01622382 | -0.01622382 | -0.01622382 | -0.01622382 | -0.01622382 | -0.01622382 | -0.01622382 | -0.01622382 |
| EBITAT | -43.0 | -159.2 | -325.5 | -253.6 | -148.6 | -150.6 | -143.6 | -136.9 | -130.6 | -124.5 |
| Depreciation | ||||||||||
| Changes in Account Receivables | ||||||||||
| Changes in Inventories | ||||||||||
| Changes in Accounts Payable | ||||||||||
| Capital Expenditure | ||||||||||
| UFCF | -194.3 | -385.5 | -364.2 | -107.5 | -133.2 | -183.0 | -156.7 | -149.4 | -142.5 | -135.9 |
| WACC, % | 4.39 | 4.39 | 4.39 | 4.39 | 4.39 | 4.39 | 4.39 | 4.39 | 4.39 | 4.39 |
| PV UFCF | ||||||||||
| SUM PV UFCF | -680.1 | |||||||||
| Long Term Growth Rate, % | 2.00 | |||||||||
| Free cash flow (T + 1) | -139 | |||||||||
| Terminal Value | -5,805 | |||||||||
| Present Terminal Value | -4,684 | |||||||||
| Enterprise Value | -5,364 | |||||||||
| Net Debt | 1,090 | |||||||||
| Equity Value | -6,454 | |||||||||
| Diluted Shares Outstanding, MM | 66 | |||||||||
| Equity Value Per Share | -97.78 |
What You Will Get
- Real BYND Financial Data: Pre-filled with Beyond Meat’s historical and projected data for precise analysis.
- Fully Editable Template: Modify key inputs like revenue growth, WACC, and EBITDA % with ease.
- Automatic Calculations: See Beyond Meat’s intrinsic value update instantly based on your changes.
- Professional Valuation Tool: Designed for investors, analysts, and consultants seeking accurate DCF results.
- User-Friendly Design: Simple structure and clear instructions for all experience levels.
Key Features
- Customizable Growth Assumptions: Adjust essential inputs such as sales growth, gross margin %, and operating expenses.
- Instant DCF Valuation: Quickly computes intrinsic value, net present value (NPV), and additional financial metrics.
- High-Precision Estimates: Leverages Beyond Meat's actual financial data for credible valuation results.
- Effortless Scenario Testing: Evaluate various scenarios and analyze results with ease.
- Efficiency Booster: Avoid the hassle of constructing intricate valuation models from the ground up.
How It Works
- Download the Template: Get instant access to the Excel-based BYND DCF Calculator.
- Input Your Assumptions: Adjust yellow-highlighted cells for growth rates, WACC, margins, and more.
- Instant Calculations: The model automatically updates Beyond Meat’s intrinsic value.
- Test Scenarios: Simulate different assumptions to evaluate potential valuation changes.
- Analyze and Decide: Use the results to guide your investment or financial analysis.
Why Choose This Calculator for Beyond Meat, Inc. (BYND)?
- Comprehensive Tool: Integrates DCF, WACC, and financial ratio analyses tailored for plant-based companies.
- Customizable Inputs: Modify yellow-highlighted cells to explore different market scenarios.
- Detailed Insights: Automatically computes Beyond Meat’s intrinsic value and Net Present Value.
- Preloaded Data: Historical and projected data provide reliable benchmarks for analysis.
- Professional Quality: Perfect for financial analysts, investors, and consultants in the food industry.
Who Should Use This Product?
- Plant-Based Diet Advocates: Understand the market dynamics of plant-based foods and their valuation.
- Researchers: Utilize professional models to study the impact of Beyond Meat's innovations on the food industry.
- Investors: Evaluate your investment strategies and analyze valuation metrics for Beyond Meat, Inc. (BYND).
- Market Analysts: Enhance your analysis with a customizable DCF model tailored for the plant-based sector.
- Entrepreneurs: Discover how leading companies like Beyond Meat are valued and the factors influencing their market performance.
What the Template Contains
- Preloaded BYND Data: Historical and projected financial data, including revenue, EBIT, and capital expenditures.
- DCF and WACC Models: Professional-grade sheets for calculating intrinsic value and Weighted Average Cost of Capital.
- Editable Inputs: Yellow-highlighted cells for adjusting revenue growth, tax rates, and discount rates.
- Financial Statements: Comprehensive annual and quarterly financials for deeper analysis.
- Key Ratios: Profitability, leverage, and efficiency ratios to evaluate performance.
- Dashboard and Charts: Visual summaries of valuation outcomes and assumptions.
Disclaimer
All information, articles, and product details provided on this website are for general informational and educational purposes only. We do not claim any ownership over, nor do we intend to infringe upon, any trademarks, copyrights, logos, brand names, or other intellectual property mentioned or depicted on this site. Such intellectual property remains the property of its respective owners, and any references here are made solely for identification or informational purposes, without implying any affiliation, endorsement, or partnership.
We make no representations or warranties, express or implied, regarding the accuracy, completeness, or suitability of any content or products presented. Nothing on this website should be construed as legal, tax, investment, financial, medical, or other professional advice. In addition, no part of this site—including articles or product references—constitutes a solicitation, recommendation, endorsement, advertisement, or offer to buy or sell any securities, franchises, or other financial instruments, particularly in jurisdictions where such activity would be unlawful.
All content is of a general nature and may not address the specific circumstances of any individual or entity. It is not a substitute for professional advice or services. Any actions you take based on the information provided here are strictly at your own risk. You accept full responsibility for any decisions or outcomes arising from your use of this website and agree to release us from any liability in connection with your use of, or reliance upon, the content or products found herein.