
|
Buzzfeed, Inc. (BZFD) DCF -Bewertung |
Fully Editable: Tailor To Your Needs In Excel Or Sheets
Professional Design: Trusted, Industry-Standard Templates
Investor-Approved Valuation Models
MAC/PC Compatible, Fully Unlocked
No Expertise Is Needed; Easy To Follow
BuzzFeed, Inc. (BZFD) Bundle
Stürzen Sie Ihre Analyse und verbessern Sie die Präzision mit unserem [BZFD] DCF -Taschenrechner! Mit tatsächlichen Daten von BuzzFeed, Inc. und anpassbaren Annahmen ermöglichen dieses Tool Sie, [Unternehmen] zu prognostizieren, zu bewerten und zu bewerten, als wären Sie ein erfahrener Investor.
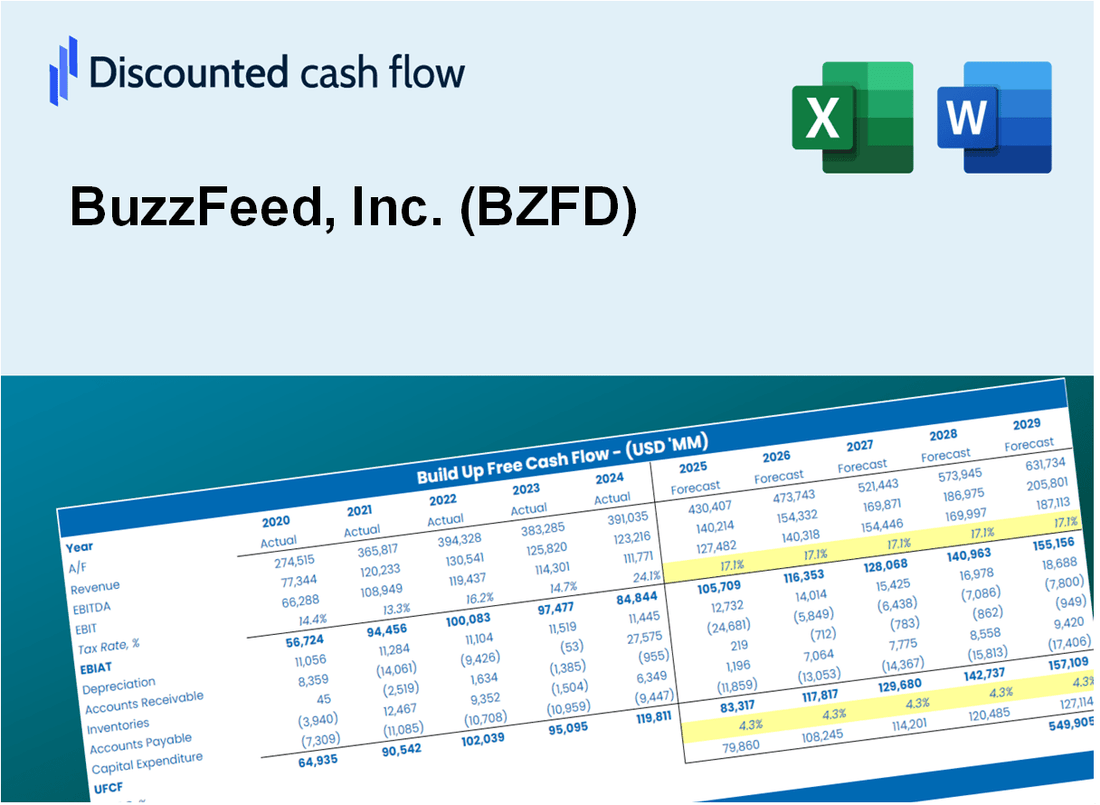
Discounted Cash Flow (DCF) - (USD MM)
| Year | AY1 2020 |
AY2 2021 |
AY3 2022 |
AY4 2023 |
AY5 2024 |
FY1 2025 |
FY2 2026 |
FY3 2027 |
FY4 2028 |
FY5 2029 |
|---|---|---|---|---|---|---|---|---|---|---|
| Revenue | 321.3 | 397.6 | 325.8 | 252.7 | 189.9 | 170.1 | 152.4 | 136.6 | 122.4 | 109.6 |
| Revenue Growth, % | 0 | 23.73 | -18.06 | -22.44 | -24.85 | -10.4 | -10.4 | -10.4 | -10.4 | -10.4 |
| EBITDA | 30.5 | 25.5 | -85.8 | -20.7 | -7.4 | -7.6 | -6.9 | -6.1 | -5.5 | -4.9 |
| EBITDA, % | 9.49 | 6.42 | -26.32 | -8.19 | -3.88 | -4.5 | -4.5 | -4.5 | -4.5 | -4.5 |
| Depreciation | 17.5 | 22.9 | 22.7 | 21.9 | 19.1 | 12.6 | 11.3 | 10.1 | 9.0 | 8.1 |
| Depreciation, % | 5.44 | 5.75 | 6.95 | 8.68 | 10.08 | 7.38 | 7.38 | 7.38 | 7.38 | 7.38 |
| EBIT | 13.0 | 2.7 | -108.4 | -42.6 | -26.5 | -20.2 | -18.1 | -16.2 | -14.5 | -13.0 |
| EBIT, % | 4.05 | 0.6736 | -33.28 | -16.88 | -13.96 | -11.88 | -11.88 | -11.88 | -11.88 | -11.88 |
| Total Cash | 90.6 | 79.7 | 55.8 | 35.6 | 38.6 | 34.0 | 30.4 | 27.3 | 24.4 | 21.9 |
| Total Cash, percent | .0 | .0 | .0 | .0 | .0 | .0 | .0 | .0 | .0 | .0 |
| Account Receivables | 106.3 | 142.9 | 116.5 | 75.7 | 48.9 | 54.6 | 48.9 | 43.8 | 39.3 | 35.2 |
| Account Receivables, % | 33.07 | 35.95 | 35.75 | 29.96 | 25.78 | 32.1 | 32.1 | 32.1 | 32.1 | 32.1 |
| Inventories | .0 | .0 | .0 | .0 | .0 | .0 | .0 | .0 | .0 | .0 |
| Inventories, % | 0 | 0 | 0 | 0 | 0 | 0 | 0 | 0 | 0 | 0 |
| Accounts Payable | 8.4 | 16.0 | 29.3 | 46.4 | 14.3 | 14.1 | 12.7 | 11.3 | 10.2 | 9.1 |
| Accounts Payable, % | 2.62 | 4.03 | 9 | 18.35 | 7.5 | 8.3 | 8.3 | 8.3 | 8.3 | 8.3 |
| Capital Expenditure | -14.5 | -16.0 | -17.8 | -14.9 | -12.8 | -9.1 | -8.1 | -7.3 | -6.5 | -5.8 |
| Capital Expenditure, % | -4.52 | -4.03 | -5.46 | -5.9 | -6.72 | -5.33 | -5.33 | -5.33 | -5.33 | -5.33 |
| Tax Rate, % | 69.68 | 69.68 | 69.68 | 69.68 | 69.68 | 69.68 | 69.68 | 69.68 | 69.68 | 69.68 |
| EBITAT | 11.1 | -125.3 | -189.7 | -64.3 | -8.0 | -12.8 | -11.4 | -10.2 | -9.2 | -8.2 |
| Depreciation | ||||||||||
| Changes in Account Receivables | ||||||||||
| Changes in Inventories | ||||||||||
| Changes in Accounts Payable | ||||||||||
| Capital Expenditure | ||||||||||
| UFCF | -83.8 | -147.5 | -145.1 | .5 | -7.0 | -15.1 | -4.1 | -3.7 | -3.3 | -2.9 |
| WACC, % | 13.21 | 7.45 | 14.19 | 14.19 | 9.49 | 11.71 | 11.71 | 11.71 | 11.71 | 11.71 |
| PV UFCF | ||||||||||
| SUM PV UFCF | -23.2 | |||||||||
| Long Term Growth Rate, % | 2.00 | |||||||||
| Free cash flow (T + 1) | -3 | |||||||||
| Terminal Value | -31 | |||||||||
| Present Terminal Value | -18 | |||||||||
| Enterprise Value | -41 | |||||||||
| Net Debt | 24 | |||||||||
| Equity Value | -65 | |||||||||
| Diluted Shares Outstanding, MM | 37 | |||||||||
| Equity Value Per Share | -1.74 |
What You Will Get
- Real BuzzFeed Data: Preloaded financials – from revenue to EBIT – based on actual and projected figures.
- Full Customization: Adjust all critical parameters (yellow cells) like WACC, growth %, and tax rates.
- Instant Valuation Updates: Automatic recalculations to analyze the impact of changes on BuzzFeed’s fair value.
- Versatile Excel Template: Tailored for quick edits, scenario testing, and detailed projections.
- Time-Saving and Accurate: Skip building models from scratch while maintaining precision and flexibility.
Key Features
- 🔍 Real-Life BZFD Financials: Pre-filled historical and projected data for BuzzFeed, Inc. (BZFD).
- ✏️ Fully Customizable Inputs: Adjust all critical parameters (yellow cells) like WACC, growth %, and tax rates.
- 📊 Professional DCF Valuation: Built-in formulas calculate BuzzFeed’s intrinsic value using the Discounted Cash Flow method.
- ⚡ Instant Results: Visualize BuzzFeed’s valuation instantly after making changes.
- Scenario Analysis: Test and compare outcomes for various financial assumptions side-by-side.
How It Works
- Step 1: Download the Excel file.
- Step 2: Review pre-entered BuzzFeed data (historical and projected).
- Step 3: Adjust key assumptions (yellow cells) based on your analysis.
- Step 4: View automatic recalculations for BuzzFeed’s intrinsic value.
- Step 5: Use the outputs for investment decisions or reporting.
Why Choose the BuzzFeed Calculator?
- All-in-One Solution: Integrates DCF, WACC, and financial ratio analyses tailored for BuzzFeed, Inc. (BZFD).
- Flexible Inputs: Modify yellow-highlighted cells to explore different scenarios specific to BuzzFeed.
- In-Depth Analysis: Automatically computes BuzzFeed’s intrinsic value and Net Present Value.
- Ready-to-Use Data: Historical and projected data provide reliable starting points for analysis.
- Expert-Level Tool: Perfect for financial analysts, investors, and business strategists focusing on BuzzFeed, Inc. (BZFD).
Who Should Use This Product?
- Investors: Accurately assess BuzzFeed, Inc.'s (BZFD) market potential before making investment choices.
- CFOs: Utilize a high-quality DCF model for comprehensive financial reporting and analysis.
- Consultants: Efficiently customize the template for valuation reports tailored to clients.
- Entrepreneurs: Acquire knowledge about financial modeling practices employed by leading digital media companies.
- Educators: Implement it as a teaching resource to illustrate valuation techniques.
What the Template Contains
- Pre-Filled Data: Contains BuzzFeed's historical financials and projections.
- Discounted Cash Flow Model: Editable DCF valuation model with automatic computations.
- Weighted Average Cost of Capital (WACC): A dedicated sheet for calculating WACC using custom inputs.
- Key Financial Ratios: Assess BuzzFeed's profitability, efficiency, and leverage metrics.
- Customizable Inputs: Easily modify revenue growth, profit margins, and tax rates.
- Clear Dashboard: Visuals and tables summarizing essential valuation outcomes.
Disclaimer
All information, articles, and product details provided on this website are for general informational and educational purposes only. We do not claim any ownership over, nor do we intend to infringe upon, any trademarks, copyrights, logos, brand names, or other intellectual property mentioned or depicted on this site. Such intellectual property remains the property of its respective owners, and any references here are made solely for identification or informational purposes, without implying any affiliation, endorsement, or partnership.
We make no representations or warranties, express or implied, regarding the accuracy, completeness, or suitability of any content or products presented. Nothing on this website should be construed as legal, tax, investment, financial, medical, or other professional advice. In addition, no part of this site—including articles or product references—constitutes a solicitation, recommendation, endorsement, advertisement, or offer to buy or sell any securities, franchises, or other financial instruments, particularly in jurisdictions where such activity would be unlawful.
All content is of a general nature and may not address the specific circumstances of any individual or entity. It is not a substitute for professional advice or services. Any actions you take based on the information provided here are strictly at your own risk. You accept full responsibility for any decisions or outcomes arising from your use of this website and agree to release us from any liability in connection with your use of, or reliance upon, the content or products found herein.