
|
Capital City Bank Group, Inc. (CCBG) DCF -Bewertung |
Fully Editable: Tailor To Your Needs In Excel Or Sheets
Professional Design: Trusted, Industry-Standard Templates
Investor-Approved Valuation Models
MAC/PC Compatible, Fully Unlocked
No Expertise Is Needed; Easy To Follow
Capital City Bank Group, Inc. (CCBG) Bundle
Verbessern Sie Ihre Anlagestrategien mit dem DCF -Taschenrechner der Capital City Bank Group, Inc. (CCBG)! Überprüfen Sie die Authentic Capital City Bank Financials, stellen Sie Wachstumsprognosen und -kosten an und beachten Sie sofort, wie sich diese Änderungen auf den inneren Wert von CCBG auswirken.
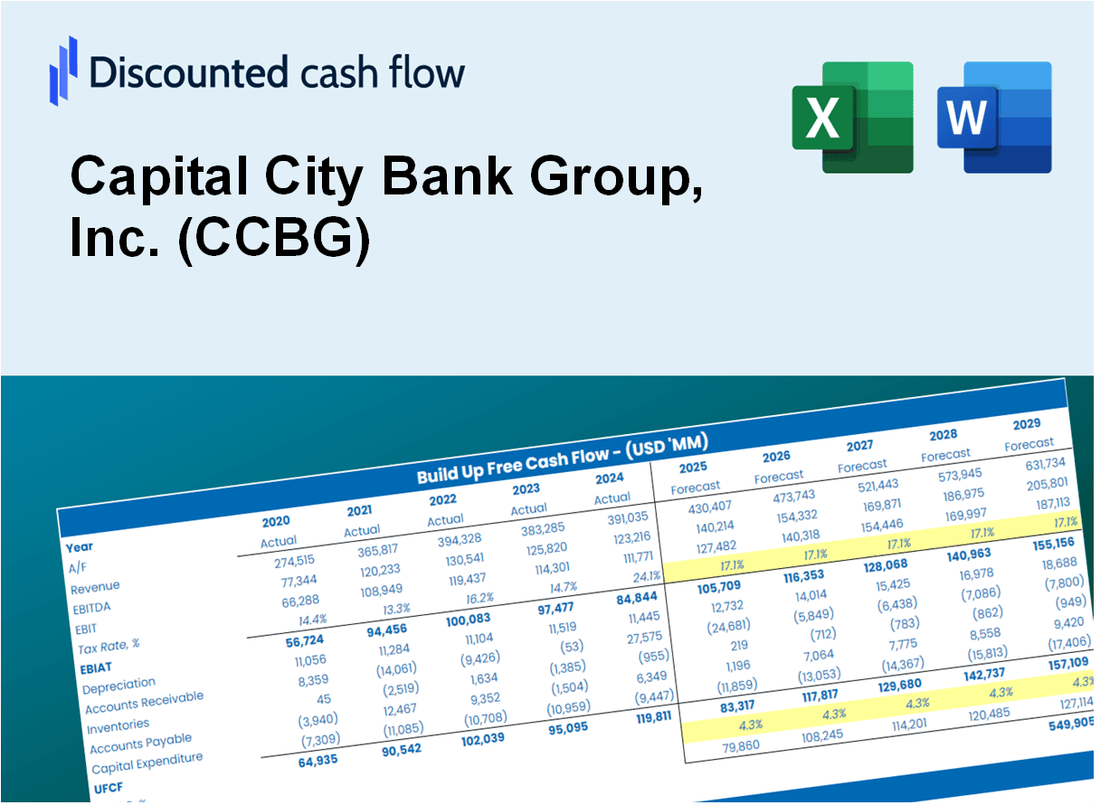
Discounted Cash Flow (DCF) - (USD MM)
| Year | AY1 2020 |
AY2 2021 |
AY3 2022 |
AY4 2023 |
AY5 2024 |
FY1 2025 |
FY2 2026 |
FY3 2027 |
FY4 2028 |
FY5 2029 |
|---|---|---|---|---|---|---|---|---|---|---|
| Revenue | 211.5 | 207.3 | 200.6 | 245.7 | 262.2 | 277.9 | 294.6 | 312.3 | 331.0 | 350.8 |
| Revenue Growth, % | 0 | -1.99 | -3.27 | 22.51 | 6.73 | 6 | 6 | 6 | 6 | 6 |
| EBITDA | 60.1 | 57.2 | 48.8 | 71.9 | 73.4 | 76.5 | 81.1 | 85.9 | 91.1 | 96.6 |
| EBITDA, % | 28.42 | 27.57 | 24.35 | 29.28 | 27.99 | 27.52 | 27.52 | 27.52 | 27.52 | 27.52 |
| Depreciation | 7.2 | 7.7 | 7.8 | 8.1 | 7.8 | 9.6 | 10.2 | 10.8 | 11.4 | 12.1 |
| Depreciation, % | 3.42 | 3.72 | 3.87 | 3.29 | 2.99 | 3.46 | 3.46 | 3.46 | 3.46 | 3.46 |
| EBIT | 52.9 | 49.5 | 41.1 | 63.9 | 65.6 | 66.9 | 70.9 | 75.2 | 79.7 | 84.4 |
| EBIT, % | 25 | 23.85 | 20.48 | 25.99 | 25 | 24.07 | 24.07 | 24.07 | 24.07 | 24.07 |
| Total Cash | 392.8 | 719.9 | 485.4 | 421.0 | 496.5 | 277.9 | 294.6 | 312.3 | 331.0 | 350.8 |
| Total Cash, percent | .0 | .0 | .0 | .0 | .0 | .0 | .0 | .0 | .0 | .0 |
| Account Receivables | .0 | .0 | .0 | .0 | .0 | .0 | .0 | .0 | .0 | .0 |
| Account Receivables, % | 0 | 0 | 0 | 0 | 0 | 0 | 0 | 0 | 0 | 0 |
| Inventories | .0 | .0 | .0 | .0 | .0 | .0 | .0 | .0 | .0 | .0 |
| Inventories, % | 0 | 0 | 0 | 0 | 0 | 0 | 0 | 0 | 0 | 0 |
| Accounts Payable | .0 | .0 | .0 | .0 | .0 | .0 | .0 | .0 | .0 | .0 |
| Accounts Payable, % | 0 | 0 | 0 | 0 | 0 | 0 | 0 | 0 | 0 | 0 |
| Capital Expenditure | -9.7 | -5.2 | -6.3 | -7.0 | -8.7 | -9.1 | -9.7 | -10.3 | -10.9 | -11.5 |
| Capital Expenditure, % | -4.6 | -2.5 | -3.15 | -2.87 | -3.31 | -3.29 | -3.29 | -3.29 | -3.29 | -3.29 |
| Tax Rate, % | 19.3 | 19.3 | 19.3 | 19.3 | 19.3 | 19.3 | 19.3 | 19.3 | 19.3 | 19.3 |
| EBITAT | 31.6 | 33.4 | 33.4 | 52.3 | 52.9 | 49.6 | 52.6 | 55.8 | 59.1 | 62.7 |
| Depreciation | ||||||||||
| Changes in Account Receivables | ||||||||||
| Changes in Inventories | ||||||||||
| Changes in Accounts Payable | ||||||||||
| Capital Expenditure | ||||||||||
| UFCF | 29.1 | 35.9 | 34.8 | 53.3 | 52.1 | 50.1 | 53.1 | 56.3 | 59.7 | 63.3 |
| WACC, % | 7.73 | 8.09 | 8.73 | 8.75 | 8.7 | 8.4 | 8.4 | 8.4 | 8.4 | 8.4 |
| PV UFCF | ||||||||||
| SUM PV UFCF | 221.1 | |||||||||
| Long Term Growth Rate, % | 2.00 | |||||||||
| Free cash flow (T + 1) | 65 | |||||||||
| Terminal Value | 1,008 | |||||||||
| Present Terminal Value | 674 | |||||||||
| Enterprise Value | 895 | |||||||||
| Net Debt | 11 | |||||||||
| Equity Value | 883 | |||||||||
| Diluted Shares Outstanding, MM | 17 | |||||||||
| Equity Value Per Share | 52.06 |
What You Will Receive
- Comprehensive Financial Model: Capital City Bank Group, Inc.'s (CCBG) actual data facilitates accurate DCF valuation.
- Complete Forecast Flexibility: Modify revenue growth, profit margins, WACC, and other essential metrics.
- Real-Time Calculations: Automatic updates provide immediate feedback as you make adjustments.
- Professional-Grade Template: A polished Excel file crafted for high-quality valuation presentations.
- Adaptable and Reusable: Designed for versatility, enabling repeated use for in-depth forecasting.
Key Features
- Authentic CCBG Financials: Gain access to precise historical data and future forecasts tailored for Capital City Bank Group, Inc. (CCBG).
- Adjustable Forecast Parameters: Modify highlighted fields such as WACC, growth rates, and profit margins to suit your analysis.
- Real-Time Calculations: Automatic updates for DCF, Net Present Value (NPV), and cash flow assessments.
- User-Friendly Dashboard: Intuitive charts and summaries that make it easy to interpret your valuation outcomes.
- Designed for All Skill Levels: A straightforward layout crafted for investors, CFOs, and consultants alike.
How It Works
- Step 1: Download the Excel file for Capital City Bank Group, Inc. (CCBG).
- Step 2: Review CCBG’s pre-filled financial data and forecasts.
- Step 3: Modify key inputs like loan growth, cost of capital, and tax rates (highlighted cells).
- Step 4: Observe the DCF model update in real-time as you adjust your assumptions.
- Step 5: Analyze the outputs and leverage the results for your investment decisions.
Why Choose Capital City Bank Group, Inc. (CCBG) Calculator?
- Comprehensive Tool: Features DCF, WACC, and financial ratio analyses all in one convenient package.
- Customizable Inputs: Modify the yellow-highlighted cells to explore different financial scenarios.
- Detailed Insights: Automatically computes CCBG’s intrinsic value and Net Present Value.
- Preloaded Data: Historical and projected data provide reliable starting points for analysis.
- Professional Quality: Perfect for financial analysts, investors, and business consultants.
Who Should Use This Product?
- Professional Investors: Develop comprehensive and precise valuation models for analyzing CCBG's portfolio.
- Corporate Finance Teams: Evaluate valuation scenarios to inform strategic decisions within the organization.
- Consultants and Advisors: Offer clients accurate valuation insights for Capital City Bank Group, Inc. (CCBG).
- Students and Educators: Utilize real-world data to enhance learning and practice in financial modeling.
- Banking Enthusiasts: Gain insights into how financial institutions like Capital City Bank Group, Inc. (CCBG) are valued in the market.
What the Template Contains
- Pre-Filled Data: Includes Capital City Bank Group, Inc.'s (CCBG) historical financials and forecasts.
- Discounted Cash Flow Model: Editable DCF valuation model with automated calculations.
- Weighted Average Cost of Capital (WACC): A dedicated sheet for calculating WACC based on tailored inputs.
- Key Financial Ratios: Analyze Capital City Bank Group, Inc.'s (CCBG) profitability, efficiency, and leverage.
- Customizable Inputs: Easily modify revenue growth, margins, and tax rates.
- Clear Dashboard: Visuals and tables summarizing essential valuation results.
Disclaimer
All information, articles, and product details provided on this website are for general informational and educational purposes only. We do not claim any ownership over, nor do we intend to infringe upon, any trademarks, copyrights, logos, brand names, or other intellectual property mentioned or depicted on this site. Such intellectual property remains the property of its respective owners, and any references here are made solely for identification or informational purposes, without implying any affiliation, endorsement, or partnership.
We make no representations or warranties, express or implied, regarding the accuracy, completeness, or suitability of any content or products presented. Nothing on this website should be construed as legal, tax, investment, financial, medical, or other professional advice. In addition, no part of this site—including articles or product references—constitutes a solicitation, recommendation, endorsement, advertisement, or offer to buy or sell any securities, franchises, or other financial instruments, particularly in jurisdictions where such activity would be unlawful.
All content is of a general nature and may not address the specific circumstances of any individual or entity. It is not a substitute for professional advice or services. Any actions you take based on the information provided here are strictly at your own risk. You accept full responsibility for any decisions or outcomes arising from your use of this website and agree to release us from any liability in connection with your use of, or reliance upon, the content or products found herein.