
|
CCL Products Limited (CCL.NS) DCF -Bewertung |
Fully Editable: Tailor To Your Needs In Excel Or Sheets
Professional Design: Trusted, Industry-Standard Templates
Investor-Approved Valuation Models
MAC/PC Compatible, Fully Unlocked
No Expertise Is Needed; Easy To Follow
CCL Products (India) Limited (CCL.NS) Bundle
Unabhängig davon, ob Sie ein Investor oder Analyst sind, ist dieser CCL Products (India) Limited (CCLNS) DCF-Taschenrechner Ihre Anlaufstelle für eine genaue Bewertung. Es wird mit echten Daten von CCL Products (India) Limited vorgeladen, sodass Sie die Prognosen anpassen und die Auswirkungen in Echtzeit beobachten können.
What You Will Receive
- Customizable Excel Template: A fully adjustable Excel-based DCF Calculator featuring pre-populated financial data for CCL Products (India) Limited (CCLNS).
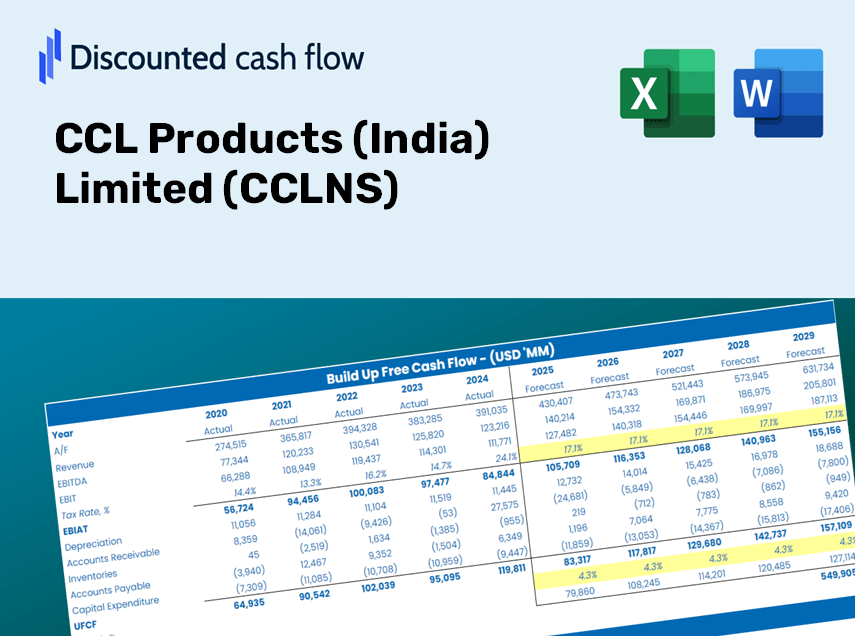
- Actual Market Data: Access to historical data and forward-looking projections (highlighted in the yellow cells).
- Flexible Forecasting: Modify forecast parameters such as revenue growth, EBITDA %, and WACC at your discretion.
- Instant Calculations: Quickly observe how your adjustments affect the valuation of CCL Products (India) Limited (CCLNS).
- Professional Resource: Designed for investors, CFOs, consultants, and financial analysts alike.
- Intuitive Layout: Organized for simplicity and ease of navigation, complete with step-by-step guidance.
Key Features
- Accurate CCL Financials: Gain access to reliable pre-loaded historical data and future forecasts for CCL Products (India) Limited (CCLNS).
- Tailored Forecast Assumptions: Modify editable yellow-highlighted cells such as WACC, growth rates, and profit margins.
- Real-Time Calculations: Automatic updates for DCF, Net Present Value (NPV), and cash flow analysis.
- User-Friendly Dashboard: Clear and concise charts and summaries for visualizing your valuation outcomes.
- Designed for Everyone: An intuitive design suited for investors, CFOs, and consultants, whether they're seasoned professionals or newcomers.
How It Functions
- Download: Obtain the pre-formatted Excel file containing CCL Products (India) Limited's [CCLNS] financial data.
- Customize: Modify projections such as revenue growth, EBITDA %, and WACC to fit your analysis.
- Update Automatically: Enjoy real-time updates for intrinsic value and NPV calculations as you make changes.
- Test Scenarios: Develop various forecasts and instantly compare the results.
- Make Decisions: Leverage the valuation insights to inform your investment strategies.
Why Choose the CCL Products (India) Limited (CCLNS) Calculator?
- Save Time: Skip the hassle of building a DCF model from the ground up – it's ready for immediate use.
- Enhance Accuracy: Dependable financial data and established formulas minimize valuation errors.
- Completely Customizable: Adjust the model to incorporate your specific assumptions and forecasts.
- User-Friendly: Intuitive charts and outputs simplify the analysis of results.
- Respected by Professionals: Crafted for experts who prioritize both precision and functionality.
Who Can Benefit from CCL Products (India) Limited (CCLNS)?
- Investors: Leverage a top-tier valuation tool for informed investment choices.
- Financial Analysts: Optimize your workflow with a customizable DCF model at your fingertips.
- Consultants: Easily modify the template for impactful client presentations or reports.
- Finance Enthusiasts: Enhance your knowledge of valuation methods through practical examples.
- Educators and Students: Utilize this resource as a hands-on learning aid in finance courses.
What the Template Contains
- Historical Data: Contains CCL Products (India) Limited's past financial performance and foundational forecasts.
- DCF and Levered DCF Models: Comprehensive templates for assessing the intrinsic value of CCL Products (India) Limited.
- WACC Sheet: Pre-configured calculations for the Weighted Average Cost of Capital.
- Editable Inputs: Customize key parameters such as growth rates, EBITDA %, and CAPEX projections.
- Quarterly and Annual Statements: A thorough analysis of CCL Products (India) Limited's financial statements.
- Interactive Dashboard: Dynamically visualize valuation outcomes and forecasts.
Disclaimer
All information, articles, and product details provided on this website are for general informational and educational purposes only. We do not claim any ownership over, nor do we intend to infringe upon, any trademarks, copyrights, logos, brand names, or other intellectual property mentioned or depicted on this site. Such intellectual property remains the property of its respective owners, and any references here are made solely for identification or informational purposes, without implying any affiliation, endorsement, or partnership.
We make no representations or warranties, express or implied, regarding the accuracy, completeness, or suitability of any content or products presented. Nothing on this website should be construed as legal, tax, investment, financial, medical, or other professional advice. In addition, no part of this site—including articles or product references—constitutes a solicitation, recommendation, endorsement, advertisement, or offer to buy or sell any securities, franchises, or other financial instruments, particularly in jurisdictions where such activity would be unlawful.
All content is of a general nature and may not address the specific circumstances of any individual or entity. It is not a substitute for professional advice or services. Any actions you take based on the information provided here are strictly at your own risk. You accept full responsibility for any decisions or outcomes arising from your use of this website and agree to release us from any liability in connection with your use of, or reliance upon, the content or products found herein.