
|
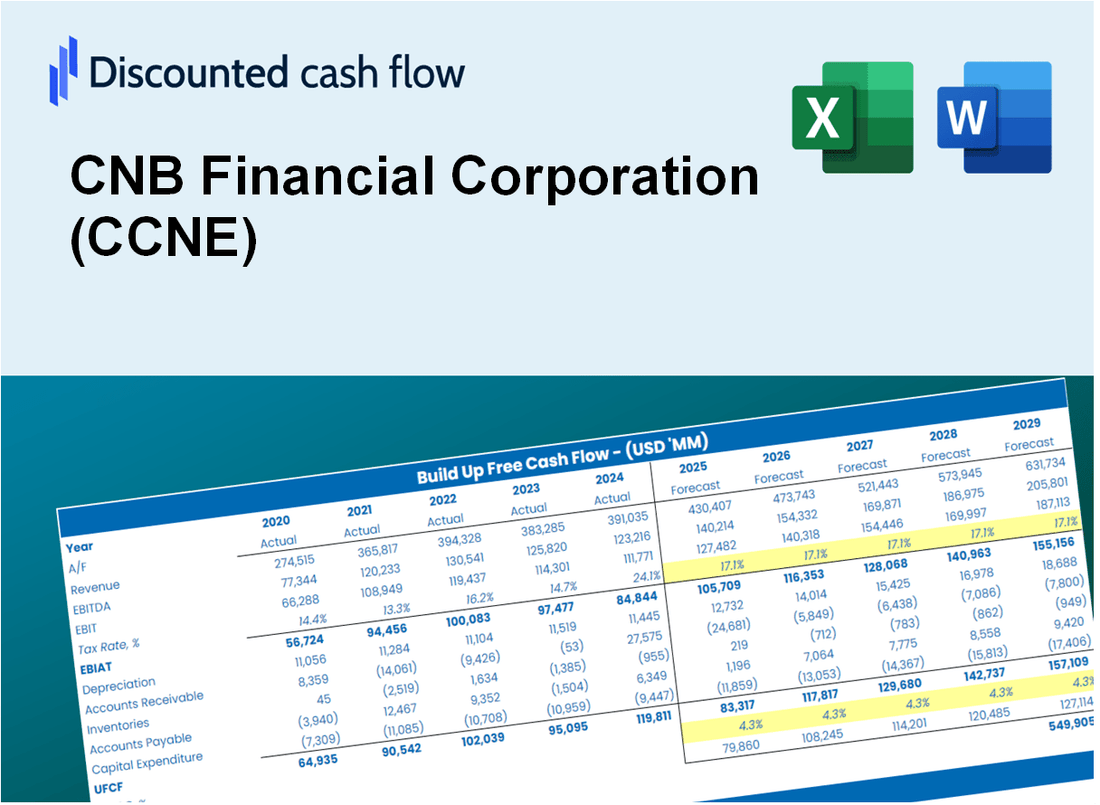
CNB Financial Corporation (CCNE) DCF -Bewertung |
Fully Editable: Tailor To Your Needs In Excel Or Sheets
Professional Design: Trusted, Industry-Standard Templates
Investor-Approved Valuation Models
MAC/PC Compatible, Fully Unlocked
No Expertise Is Needed; Easy To Follow
CNB Financial Corporation (CCNE) Bundle
Möchten Sie den inneren Wert der CNB Financial Corporation bestimmen? Unser (CCNE) DCF-Taschenrechner integriert reale Daten mit umfangreichen Anpassungsfunktionen, sodass Sie Ihre Prognosen verfeinern und Ihre Anlageentscheidungen verbessern können.
What You Will Receive
- Comprehensive Financial Model: Utilize CNB Financial Corporation’s (CCNE) actual data for accurate DCF valuation.
- Complete Forecast Control: Modify revenue growth, profit margins, WACC, and other essential parameters.
- Real-Time Calculations: Automatic updates provide immediate results as you adjust inputs.
- Professional-Grade Template: An expertly crafted Excel file designed for high-quality valuation.
- Flexible and Reusable: Customizable for ongoing use, ideal for in-depth financial forecasts.
Key Features
- Comprehensive CCNE Data: Pre-loaded with CNB Financial Corporation’s historical performance metrics and future forecasts.
- Customizable Assumptions: Tailor inputs for loan growth, interest margins, capital ratios, and operational expenses.
- Interactive Valuation Framework: Real-time adjustments to Net Present Value (NPV) and intrinsic value based on user-defined parameters.
- What-If Analysis: Develop various forecasting scenarios to explore different valuation possibilities.
- Intuitive Interface: Designed for ease of use, catering to both industry professionals and newcomers.
How It Works
- Step 1: Download the Excel file.
- Step 2: Review CNB Financial Corporation’s (CCNE) pre-filled financial data and forecasts.
- Step 3: Modify key inputs such as revenue growth, WACC, and tax rates (highlighted cells).
- Step 4: Observe the DCF model update in real-time as you adjust your assumptions.
- Step 5: Analyze the results and utilize the findings for your investment decisions.
Why Choose This Calculator for CNB Financial Corporation (CCNE)?
- User-Friendly Interface: Tailored for both novices and seasoned professionals.
- Customizable Inputs: Adjust parameters effortlessly to suit your financial analysis.
- Real-Time Adjustments: Watch CNB Financial's valuation update instantly as you change inputs.
- Preloaded Data: Comes equipped with CNB Financial’s latest financial metrics for immediate evaluation.
- Relied Upon by Experts: A go-to tool for investors and analysts seeking to make well-informed choices.
Who Should Use This Product?
- Investors: Assess CNB Financial Corporation’s (CCNE) valuation before making investment decisions.
- CFOs and Financial Analysts: Optimize valuation methodologies and evaluate financial forecasts.
- Startup Founders: Understand the valuation practices of established financial institutions like CNB Financial Corporation.
- Consultants: Provide comprehensive valuation analyses and reports for clients in the financial sector.
- Students and Educators: Utilize current market data to enhance learning and teach valuation strategies.
What the Template Contains
- Comprehensive DCF Model: Editable template featuring extensive valuation calculations.
- Real-World Data: CNB Financial Corporation’s (CCNE) historical and projected financials preloaded for analysis.
- Customizable Parameters: Modify WACC, growth rates, and tax assumptions to explore various scenarios.
- Financial Statements: Complete annual and quarterly breakdowns for enhanced insights.
- Key Ratios: Integrated analysis for profitability, efficiency, and leverage metrics.
- Dashboard with Visual Outputs: Charts and tables designed for clear, actionable results.
Disclaimer
All information, articles, and product details provided on this website are for general informational and educational purposes only. We do not claim any ownership over, nor do we intend to infringe upon, any trademarks, copyrights, logos, brand names, or other intellectual property mentioned or depicted on this site. Such intellectual property remains the property of its respective owners, and any references here are made solely for identification or informational purposes, without implying any affiliation, endorsement, or partnership.
We make no representations or warranties, express or implied, regarding the accuracy, completeness, or suitability of any content or products presented. Nothing on this website should be construed as legal, tax, investment, financial, medical, or other professional advice. In addition, no part of this site—including articles or product references—constitutes a solicitation, recommendation, endorsement, advertisement, or offer to buy or sell any securities, franchises, or other financial instruments, particularly in jurisdictions where such activity would be unlawful.
All content is of a general nature and may not address the specific circumstances of any individual or entity. It is not a substitute for professional advice or services. Any actions you take based on the information provided here are strictly at your own risk. You accept full responsibility for any decisions or outcomes arising from your use of this website and agree to release us from any liability in connection with your use of, or reliance upon, the content or products found herein.