
|
Cogent Communications Holdings, Inc. (CCOI) DCF -Bewertung |
Fully Editable: Tailor To Your Needs In Excel Or Sheets
Professional Design: Trusted, Industry-Standard Templates
Investor-Approved Valuation Models
MAC/PC Compatible, Fully Unlocked
No Expertise Is Needed; Easy To Follow
Cogent Communications Holdings, Inc. (CCOI) Bundle
Entdecken Sie die finanzielle Zukunft von Cogent Communications Holdings, Inc. (CCOI) mit unserem benutzerfreundlichen DCF-Taschenrechner! Geben Sie Ihre Annahmen in Bezug auf Wachstum, Margen und Kosten ein, um den inneren Wert von Cogent Communications Holdings, Inc. (CCOI) zu bestimmen und Ihre Anlagestrategie zu verbessern.
What You Will Get
- Real CCOI Financials: Access to historical and projected data for precise valuation.
- Customizable Inputs: Adjust WACC, tax rates, revenue growth, and capital expenditures as needed.
- Dynamic Calculations: Intrinsic value and NPV are computed in real-time.
- Scenario Analysis: Explore various scenarios to assess Cogent Communications' future performance.
- User-Friendly Design: Designed for professionals while remaining approachable for newcomers.
Key Features
- Customizable Financial Metrics: Adjust essential inputs such as revenue growth, operating margin, and capital investments.
- Instant DCF Valuation: Quickly computes intrinsic value, NPV, and various financial outputs.
- High-Precision Accuracy: Leverages Cogent Communications' real-world financial data for dependable valuation results.
- Streamlined Scenario Analysis: Easily evaluate different scenarios and analyze their outcomes.
- Efficiency Booster: Avoid the hassle of constructing intricate valuation models from the ground up.
How It Works
- Download the Template: Gain immediate access to the Excel-based CCOI DCF Calculator.
- Input Your Assumptions: Modify the yellow-highlighted cells for growth rates, WACC, margins, and additional variables.
- Instant Calculations: The model automatically recalculates Cogent Communications' intrinsic value.
- Test Scenarios: Experiment with various assumptions to assess potential changes in valuation.
- Analyze and Decide: Utilize the outcomes to inform your investment or financial analysis.
Why Choose This Calculator for Cogent Communications Holdings, Inc. (CCOI)?
- All-in-One Solution: Features DCF, WACC, and financial ratio analyses tailored for CCOI.
- Flexible Inputs: Modify yellow-highlighted fields to explore different financial scenarios.
- In-Depth Analysis: Automatically computes CCOI’s intrinsic value and Net Present Value.
- Data-Rich Environment: Comes with historical and projected data for reliable baseline assessments.
- Expert-Level Tool: Perfect for financial analysts, investors, and business advisors focusing on CCOI.
Who Should Use This Product?
- Investors: Accurately estimate Cogent Communications Holdings, Inc.'s (CCOI) fair value before making investment decisions.
- CFOs: Leverage a professional-grade DCF model for financial reporting and analysis specific to Cogent Communications.
- Consultants: Quickly adapt the template for valuation reports tailored to clients in the telecommunications sector.
- Entrepreneurs: Gain insights into financial modeling practices utilized by leading companies in the industry.
- Educators: Use it as a teaching tool to demonstrate valuation methodologies relevant to the telecommunications market.
What the Template Contains
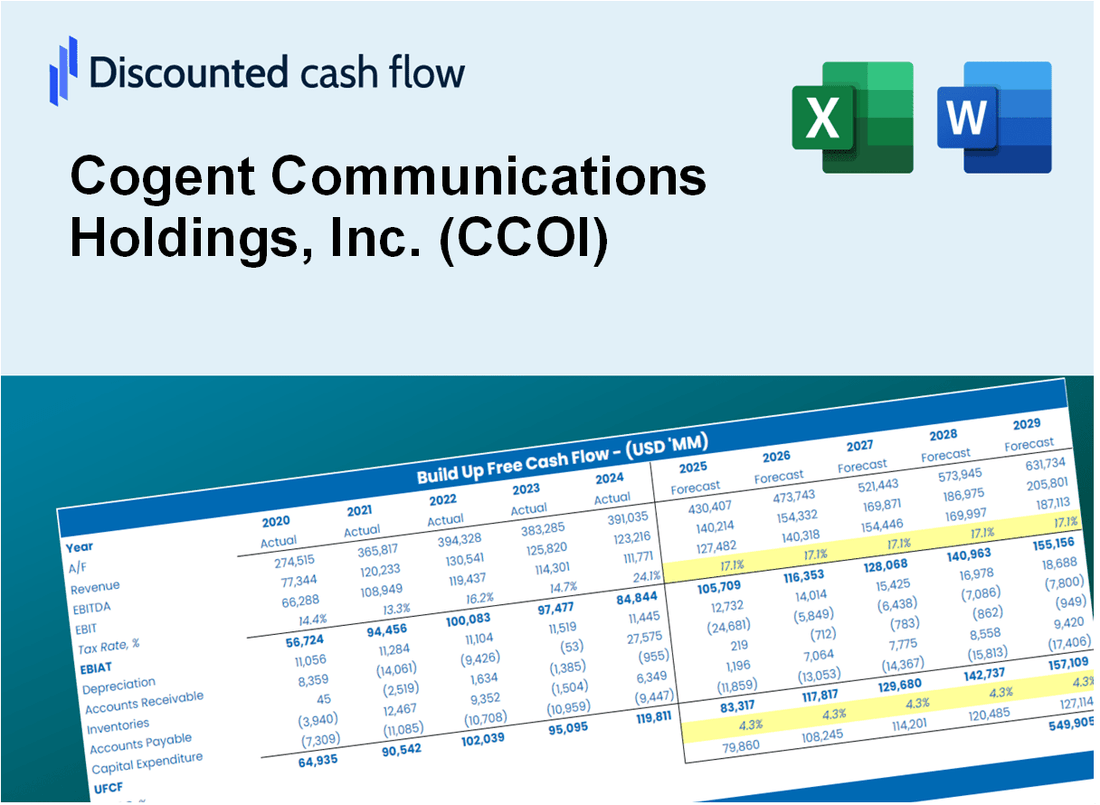
- Preloaded CCOI Data: Historical and projected financial data, including revenue, EBIT, and capital expenditures.
- DCF and WACC Models: Professional-grade sheets for calculating intrinsic value and Weighted Average Cost of Capital.
- Editable Inputs: Yellow-highlighted cells for adjusting revenue growth, tax rates, and discount rates.
- Financial Statements: Comprehensive annual and quarterly financials for deeper analysis.
- Key Ratios: Profitability, leverage, and efficiency ratios to evaluate performance.
- Dashboard and Charts: Visual summaries of valuation outcomes and assumptions.
Disclaimer
All information, articles, and product details provided on this website are for general informational and educational purposes only. We do not claim any ownership over, nor do we intend to infringe upon, any trademarks, copyrights, logos, brand names, or other intellectual property mentioned or depicted on this site. Such intellectual property remains the property of its respective owners, and any references here are made solely for identification or informational purposes, without implying any affiliation, endorsement, or partnership.
We make no representations or warranties, express or implied, regarding the accuracy, completeness, or suitability of any content or products presented. Nothing on this website should be construed as legal, tax, investment, financial, medical, or other professional advice. In addition, no part of this site—including articles or product references—constitutes a solicitation, recommendation, endorsement, advertisement, or offer to buy or sell any securities, franchises, or other financial instruments, particularly in jurisdictions where such activity would be unlawful.
All content is of a general nature and may not address the specific circumstances of any individual or entity. It is not a substitute for professional advice or services. Any actions you take based on the information provided here are strictly at your own risk. You accept full responsibility for any decisions or outcomes arising from your use of this website and agree to release us from any liability in connection with your use of, or reliance upon, the content or products found herein.