
|
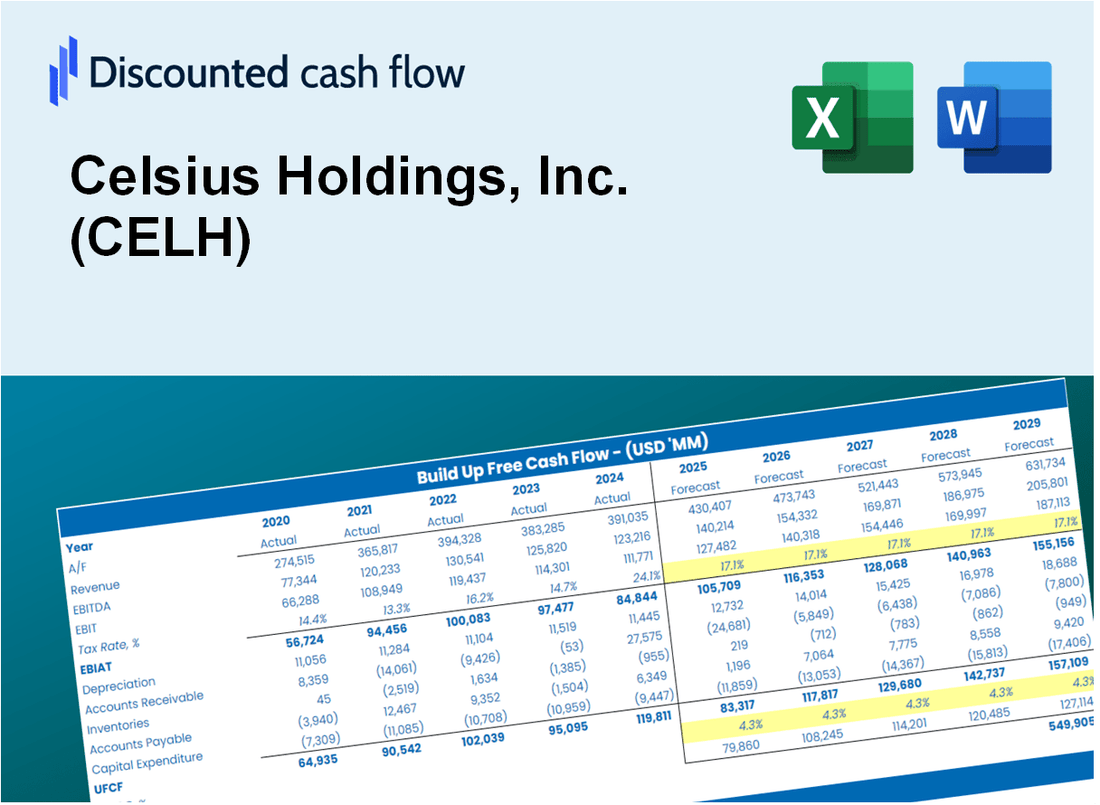
Celsius Holdings, Inc. (CELH) DCF -Bewertung |
Fully Editable: Tailor To Your Needs In Excel Or Sheets
Professional Design: Trusted, Industry-Standard Templates
Investor-Approved Valuation Models
MAC/PC Compatible, Fully Unlocked
No Expertise Is Needed; Easy To Follow
Celsius Holdings, Inc. (CELH) Bundle
Egal, ob Sie ein Investor oder Analyst sind, dieser DCF-Taschenrechner von Celsius Holdings, Inc. (CELH) ist Ihre Anlaufstelle für eine genaue Bewertung. Mit realen Daten von Celsius Holdings, Inc. können Sie Prognosen anpassen und die Auswirkungen in Echtzeit beobachten.
Discounted Cash Flow (DCF) - (USD MM)
| Year | AY1 2020 |
AY2 2021 |
AY3 2022 |
AY4 2023 |
AY5 2024 |
FY1 2025 |
FY2 2026 |
FY3 2027 |
FY4 2028 |
FY5 2029 |
|---|---|---|---|---|---|---|---|---|---|---|
| Revenue | 130.7 | 314.3 | 653.6 | 1,318.0 | 1,355.6 | 2,382.0 | 4,185.5 | 7,354.6 | 12,923.0 | 22,707.4 |
| Revenue Growth, % | 0 | 140.41 | 107.97 | 101.65 | 2.85 | 75.71 | 75.71 | 75.71 | 75.71 | 75.71 |
| EBITDA | 11.3 | -2.8 | -155.9 | 269.6 | 163.0 | 78.2 | 137.3 | 241.3 | 424.0 | 745.0 |
| EBITDA, % | 8.66 | -0.88681 | -23.85 | 20.45 | 12.02 | 3.28 | 3.28 | 3.28 | 3.28 | 3.28 |
| Depreciation | 1.6 | 1.3 | 1.9 | 3.2 | 7.3 | 12.9 | 22.7 | 39.8 | 70.0 | 123.0 |
| Depreciation, % | 1.23 | 0.4022 | 0.2933 | 0.24476 | 0.53658 | 0.54184 | 0.54184 | 0.54184 | 0.54184 | 0.54184 |
| EBIT | 9.7 | -4.1 | -157.8 | 266.4 | 155.7 | 65.2 | 114.6 | 201.5 | 354.0 | 622.0 |
| EBIT, % | 7.43 | -1.29 | -24.14 | 20.21 | 11.49 | 2.74 | 2.74 | 2.74 | 2.74 | 2.74 |
| Total Cash | 43.2 | 16.3 | 614.2 | 756.0 | 890.2 | 1,216.0 | 2,136.7 | 3,754.4 | 6,597.0 | 11,591.8 |
| Total Cash, percent | .0 | .0 | .0 | .0 | .0 | .0 | .0 | .0 | .0 | .0 |
| Account Receivables | 16.9 | 41.3 | 66.3 | 186.0 | 270.3 | 334.7 | 588.1 | 1,033.4 | 1,815.8 | 3,190.6 |
| Account Receivables, % | 12.91 | 13.15 | 10.14 | 14.11 | 19.94 | 14.05 | 14.05 | 14.05 | 14.05 | 14.05 |
| Inventories | 18.4 | 191.2 | 173.3 | 229.3 | 131.2 | 612.2 | 1,075.8 | 1,890.2 | 3,321.4 | 5,836.2 |
| Inventories, % | 14.08 | 60.85 | 26.51 | 17.4 | 9.68 | 25.7 | 25.7 | 25.7 | 25.7 | 25.7 |
| Accounts Payable | 11.9 | 35.8 | 36.2 | 42.8 | 41.3 | 153.9 | 270.5 | 475.2 | 835.0 | 1,467.2 |
| Accounts Payable, % | 9.07 | 11.4 | 5.55 | 3.25 | 3.05 | 6.46 | 6.46 | 6.46 | 6.46 | 6.46 |
| Capital Expenditure | -.6 | -3.2 | -8.3 | -17.4 | -23.4 | -27.4 | -48.2 | -84.6 | -148.7 | -261.3 |
| Capital Expenditure, % | -0.43909 | -1 | -1.26 | -1.32 | -1.73 | -1.15 | -1.15 | -1.15 | -1.15 | -1.15 |
| Tax Rate, % | 25.62 | 25.62 | 25.62 | 25.62 | 25.62 | 25.62 | 25.62 | 25.62 | 25.62 | 25.62 |
| EBITAT | 9.6 | 3.9 | -193.6 | 207.1 | 115.8 | 45.8 | 80.4 | 141.3 | 248.3 | 436.4 |
| Depreciation | ||||||||||
| Changes in Account Receivables | ||||||||||
| Changes in Inventories | ||||||||||
| Changes in Accounts Payable | ||||||||||
| Capital Expenditure | ||||||||||
| UFCF | -12.8 | -171.3 | -206.5 | 23.7 | 111.9 | -401.5 | -545.5 | -958.5 | -1,684.1 | -2,959.3 |
| WACC, % | 8.31 | 8.31 | 8.31 | 8.31 | 8.31 | 8.31 | 8.31 | 8.31 | 8.31 | 8.31 |
| PV UFCF | ||||||||||
| SUM PV UFCF | -4,798.9 | |||||||||
| Long Term Growth Rate, % | 2.00 | |||||||||
| Free cash flow (T + 1) | -3,018 | |||||||||
| Terminal Value | -47,822 | |||||||||
| Present Terminal Value | -32,081 | |||||||||
| Enterprise Value | -36,880 | |||||||||
| Net Debt | -870 | |||||||||
| Equity Value | -36,010 | |||||||||
| Diluted Shares Outstanding, MM | 237 | |||||||||
| Equity Value Per Share | -151.68 |
What You Will Receive
- Customizable Excel Template: A fully adjustable Excel-based DCF Calculator featuring pre-filled actual CELH financials.
- Authentic Data: Historical figures and forward-looking projections (highlighted in the yellow cells).
- Forecast Customization: Modify forecast parameters such as revenue growth, EBITDA %, and WACC.
- Instant Calculations: Quickly observe how your inputs influence Celsius Holdings' valuation.
- Professional Resource: Designed for investors, CFOs, consultants, and financial analysts.
- User-Centric Layout: Organized for clarity and simplicity, complete with step-by-step guidance.
Key Features
- Authentic Celsius Financial Data: Gain access to reliable pre-loaded historical figures and future forecasts.
- Adjustable Forecast Parameters: Modify highlighted cells for WACC, growth rates, and profit margins.
- Real-Time Calculations: Automatic adjustments to DCF, Net Present Value (NPV), and cash flow assessments.
- Interactive Dashboard: User-friendly charts and summaries to help visualize your valuation outcomes.
- Designed for All Users: An easy-to-navigate layout tailored for investors, CFOs, and consultants alike.
How It Works
- Download the Template: Gain immediate access to the Excel-based CELH DCF Calculator.
- Input Your Assumptions: Modify the yellow-highlighted cells for growth rates, WACC, margins, and other variables.
- Instant Calculations: The model will automatically recalculate Celsius Holdings’ intrinsic value.
- Test Scenarios: Experiment with various assumptions to assess potential valuation impacts.
- Analyze and Decide: Leverage the results to inform your investment or financial decisions.
Why Choose This Calculator for Celsius Holdings, Inc. (CELH)?
- Designed for Experts: A sophisticated tool utilized by financial analysts, CFOs, and industry consultants.
- Accurate Data: Celsius's historical and projected financials preloaded for reliable analysis.
- Flexible Scenario Analysis: Effortlessly simulate various forecasts and assumptions.
- Comprehensive Outputs: Automatically computes intrinsic value, NPV, and essential financial metrics.
- User-Friendly: Detailed step-by-step instructions to assist you throughout the process.
Who Should Use This Product?
- Individual Investors: Make informed decisions about buying or selling Celsius Holdings, Inc. (CELH) stock.
- Financial Analysts: Streamline valuation processes with ready-to-use financial models for Celsius Holdings, Inc. (CELH).
- Consultants: Deliver professional valuation insights on Celsius Holdings, Inc. (CELH) to clients quickly and accurately.
- Business Owners: Understand how companies like Celsius Holdings, Inc. (CELH) are valued to guide your own strategy.
- Finance Students: Learn valuation techniques using real-world data and scenarios related to Celsius Holdings, Inc. (CELH).
What the Template Contains
- Preloaded CELH Data: Historical and projected financial data, including revenue, EBIT, and capital expenditures.
- DCF and WACC Models: Professional-grade sheets for calculating intrinsic value and Weighted Average Cost of Capital.
- Editable Inputs: Yellow-highlighted cells for adjusting revenue growth, tax rates, and discount rates.
- Financial Statements: Comprehensive annual and quarterly financials for deeper analysis.
- Key Ratios: Profitability, leverage, and efficiency ratios to evaluate performance.
- Dashboard and Charts: Visual summaries of valuation outcomes and assumptions.
Disclaimer
All information, articles, and product details provided on this website are for general informational and educational purposes only. We do not claim any ownership over, nor do we intend to infringe upon, any trademarks, copyrights, logos, brand names, or other intellectual property mentioned or depicted on this site. Such intellectual property remains the property of its respective owners, and any references here are made solely for identification or informational purposes, without implying any affiliation, endorsement, or partnership.
We make no representations or warranties, express or implied, regarding the accuracy, completeness, or suitability of any content or products presented. Nothing on this website should be construed as legal, tax, investment, financial, medical, or other professional advice. In addition, no part of this site—including articles or product references—constitutes a solicitation, recommendation, endorsement, advertisement, or offer to buy or sell any securities, franchises, or other financial instruments, particularly in jurisdictions where such activity would be unlawful.
All content is of a general nature and may not address the specific circumstances of any individual or entity. It is not a substitute for professional advice or services. Any actions you take based on the information provided here are strictly at your own risk. You accept full responsibility for any decisions or outcomes arising from your use of this website and agree to release us from any liability in connection with your use of, or reliance upon, the content or products found herein.