
|
CESC Limited (CESC.NS) DCF -Bewertung |
Fully Editable: Tailor To Your Needs In Excel Or Sheets
Professional Design: Trusted, Industry-Standard Templates
Investor-Approved Valuation Models
MAC/PC Compatible, Fully Unlocked
No Expertise Is Needed; Easy To Follow
CESC Limited (CESC.NS) Bundle
Bewerten Sie die finanziellen Aussichten von CESC Limited mit Fachwissen! Dieser (CESCNS) DCF-Taschenrechner bietet Ihnen vorgefüllte Finanzdaten und die Möglichkeit, das Umsatzwachstum, WACC, Margen und andere wesentliche Annahmen anzupassen, um sich an Ihren Projektionen anzupassen.
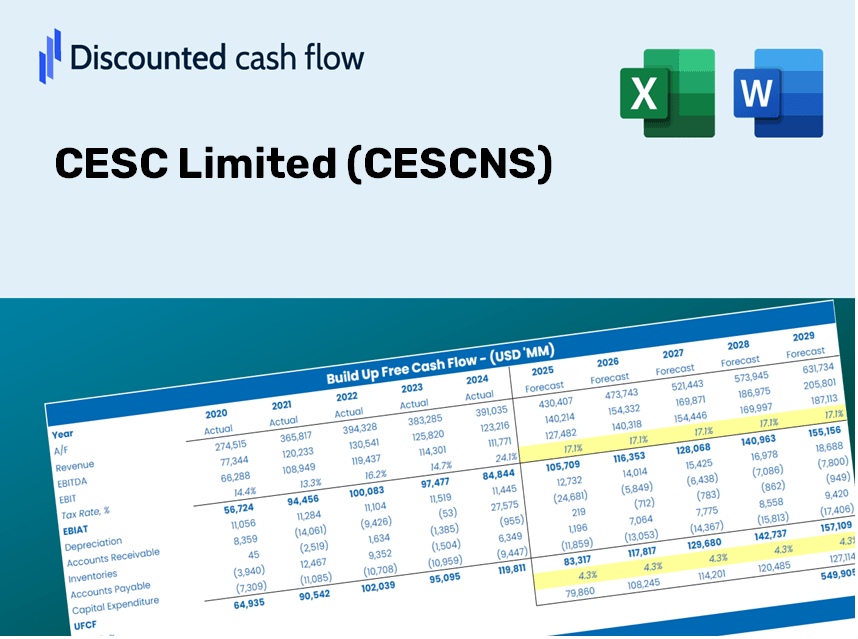
Discounted Cash Flow (DCF) - (USD MM)
| Year | AY1 2021 |
AY2 2022 |
AY3 2023 |
AY4 2024 |
AY5 2025 |
FY1 2026 |
FY2 2027 |
FY3 2028 |
FY4 2029 |
FY5 2030 |
|---|---|---|---|---|---|---|---|---|---|---|
| Revenue | 116,386.1 | 125,438.8 | 142,460.0 | 152,932.1 | 170,010.0 | 186,953.8 | 205,586.2 | 226,075.7 | 248,607.1 | 273,384.2 |
| Revenue Growth, % | 0 | 7.78 | 13.57 | 7.35 | 11.17 | 9.97 | 9.97 | 9.97 | 9.97 | 9.97 |
| EBITDA | 38,315.0 | 39,294.4 | 37,342.1 | 41,337.6 | 28,440.0 | 50,184.7 | 55,186.3 | 60,686.4 | 66,734.6 | 73,385.6 |
| EBITDA, % | 32.92 | 31.33 | 26.21 | 27.03 | 16.73 | 26.84 | 26.84 | 26.84 | 26.84 | 26.84 |
| Depreciation | 8,666.5 | 8,846.6 | 8,778.7 | 12,167.3 | 12,050.0 | 13,350.3 | 14,680.9 | 16,144.0 | 17,753.0 | 19,522.3 |
| Depreciation, % | 7.45 | 7.05 | 6.16 | 7.96 | 7.09 | 7.14 | 7.14 | 7.14 | 7.14 | 7.14 |
| EBIT | 29,648.5 | 30,447.8 | 28,563.4 | 29,170.3 | 16,390.0 | 36,834.4 | 40,505.4 | 44,542.4 | 48,981.6 | 53,863.3 |
| EBIT, % | 25.47 | 24.27 | 20.05 | 19.07 | 9.64 | 19.7 | 19.7 | 19.7 | 19.7 | 19.7 |
| Total Cash | 20,268.9 | 32,295.9 | 25,746.4 | 25,898.8 | 40,420.0 | 38,117.7 | 41,916.6 | 46,094.2 | 50,688.1 | 55,739.9 |
| Total Cash, percent | .0 | .0 | .0 | .0 | .0 | .0 | .0 | .0 | .0 | .0 |
| Account Receivables | 25,027.2 | 22,458.2 | 23,663.5 | 24,486.4 | 24,320.0 | 32,281.0 | 35,498.3 | 39,036.2 | 42,926.6 | 47,204.8 |
| Account Receivables, % | 21.5 | 17.9 | 16.61 | 16.01 | 14.31 | 17.27 | 17.27 | 17.27 | 17.27 | 17.27 |
| Inventories | 6,825.7 | 10,113.0 | 13,622.4 | 11,907.1 | 7,250.0 | 13,288.4 | 14,612.8 | 16,069.2 | 17,670.7 | 19,431.8 |
| Inventories, % | 5.86 | 8.06 | 9.56 | 7.79 | 4.26 | 7.11 | 7.11 | 7.11 | 7.11 | 7.11 |
| Accounts Payable | 9,322.7 | 10,415.8 | 10,898.2 | 12,719.4 | 15,880.0 | 15,562.5 | 17,113.5 | 18,819.1 | 20,694.7 | 22,757.2 |
| Accounts Payable, % | 8.01 | 8.3 | 7.65 | 8.32 | 9.34 | 8.32 | 8.32 | 8.32 | 8.32 | 8.32 |
| Capital Expenditure | -6,828.1 | -7,780.7 | -6,955.4 | -7,711.6 | -18,630.0 | -12,321.2 | -13,549.2 | -14,899.6 | -16,384.5 | -18,017.4 |
| Capital Expenditure, % | -5.87 | -6.2 | -4.88 | -5.04 | -10.96 | -6.59 | -6.59 | -6.59 | -6.59 | -6.59 |
| Tax Rate, % | 23.18 | 23.18 | 23.18 | 23.18 | 23.18 | 23.18 | 23.18 | 23.18 | 23.18 | 23.18 |
| EBITAT | 22,528.8 | 21,587.4 | 22,055.0 | 23,853.5 | 12,591.4 | 28,192.8 | 31,002.6 | 34,092.5 | 37,490.2 | 41,226.6 |
| Depreciation | ||||||||||
| Changes in Account Receivables | ||||||||||
| Changes in Inventories | ||||||||||
| Changes in Accounts Payable | ||||||||||
| Capital Expenditure | ||||||||||
| UFCF | 1,837.0 | 23,028.1 | 19,646.0 | 31,022.8 | 13,995.5 | 14,905.0 | 29,143.7 | 32,048.3 | 35,242.3 | 38,754.7 |
| WACC, % | 5.08 | 4.91 | 5.12 | 5.27 | 5.11 | 5.1 | 5.1 | 5.1 | 5.1 | 5.1 |
| PV UFCF | ||||||||||
| SUM PV UFCF | 127,273.6 | |||||||||
| Long Term Growth Rate, % | 2.00 | |||||||||
| Free cash flow (T + 1) | 39,530 | |||||||||
| Terminal Value | 1,274,897 | |||||||||
| Present Terminal Value | 994,142 | |||||||||
| Enterprise Value | 1,121,416 | |||||||||
| Net Debt | 139,360 | |||||||||
| Equity Value | 982,056 | |||||||||
| Diluted Shares Outstanding, MM | 1,327 | |||||||||
| Equity Value Per Share | 740.31 |
Benefits You Will Receive
- Customizable Excel Template: A comprehensive DCF Calculator in Excel featuring pre-populated financial data for CESC Limited (CESCNS).
- Accurate Financial Data: Access to historical data along with forward-looking projections (highlighted in the yellow cells).
- Adaptive Forecasting: Adjust key assumptions such as revenue growth rates, EBITDA margins, and WACC.
- Instant Calculations: Quickly observe how your inputs affect the valuation of CESC Limited (CESCNS).
- Professional Resource: Designed for use by investors, CFOs, consultants, and financial analysts.
- Intuitive Layout: Organized for straightforward navigation and ease of use, complete with step-by-step guidance.
Key Features
- Real-Time CESC Data: Pre-loaded with CESC Limited’s historical financials and forward-looking estimates.
- Completely Customizable Inputs: Modify revenue growth rates, profit margins, WACC, tax percentages, and capital expenditures.
- Dynamic Valuation Model: Instantly updates Net Present Value (NPV) and intrinsic value based on your input adjustments.
- Scenario Analysis: Develop various forecasting scenarios to evaluate different valuation results.
- User-Friendly Interface: Intuitive and organized, catering to both professionals and newcomers.
How It Works
- Step 1: Download the Excel file.
- Step 2: Review the pre-filled data for CESC Limited (CESCNS) covering historical and projected figures.
- Step 3: Modify key assumptions (highlighted in yellow) in accordance with your analysis.
- Step 4: Observe the automatic recalculations reflecting CESC Limited’s (CESCNS) intrinsic value.
- Step 5: Utilize the results for your investment strategies or reporting needs.
Why Opt for This CESC Limited Calculator?
- Accuracy: Real CESC Limited financials ensure precise data.
- Flexibility: Built for users to experiment with and adjust inputs effortlessly.
- Time-Saving: Eliminate the need to create a DCF model from the ground up.
- Professional-Grade: Crafted with CFO-level attention to detail and usability.
- User-Friendly: Simple to navigate, even for those lacking advanced financial modeling skills.
Who Should Use This Product?
- Individual Investors: Make informed decisions about buying or selling CESC Limited (CESCNS) stock.
- Financial Analysts: Enhance valuation processes with readily available financial models specific to CESC Limited (CESCNS).
- Consultants: Provide clients with accurate and timely valuation insights for CESC Limited (CESCNS).
- Business Owners: Gain insights into how companies like CESC Limited (CESCNS) are valued to inform your own business strategies.
- Finance Students: Explore valuation techniques using real-world cases and data from CESC Limited (CESCNS).
What the Template Includes
- Historical Data: Contains CESC Limited’s past financials and baseline forecasts.
- DCF and Levered DCF Models: Comprehensive templates for calculating the intrinsic value of CESC Limited (CESCNS).
- WACC Sheet: Pre-calculated metrics for Weighted Average Cost of Capital.
- Editable Inputs: Adjust critical drivers such as growth rates, EBITDA %, and CAPEX assumptions.
- Quarterly and Annual Statements: An in-depth overview of CESC Limited’s financial performance.
- Interactive Dashboard: Dynamically visualize valuation outcomes and projections.
Disclaimer
All information, articles, and product details provided on this website are for general informational and educational purposes only. We do not claim any ownership over, nor do we intend to infringe upon, any trademarks, copyrights, logos, brand names, or other intellectual property mentioned or depicted on this site. Such intellectual property remains the property of its respective owners, and any references here are made solely for identification or informational purposes, without implying any affiliation, endorsement, or partnership.
We make no representations or warranties, express or implied, regarding the accuracy, completeness, or suitability of any content or products presented. Nothing on this website should be construed as legal, tax, investment, financial, medical, or other professional advice. In addition, no part of this site—including articles or product references—constitutes a solicitation, recommendation, endorsement, advertisement, or offer to buy or sell any securities, franchises, or other financial instruments, particularly in jurisdictions where such activity would be unlawful.
All content is of a general nature and may not address the specific circumstances of any individual or entity. It is not a substitute for professional advice or services. Any actions you take based on the information provided here are strictly at your own risk. You accept full responsibility for any decisions or outcomes arising from your use of this website and agree to release us from any liability in connection with your use of, or reliance upon, the content or products found herein.