
|
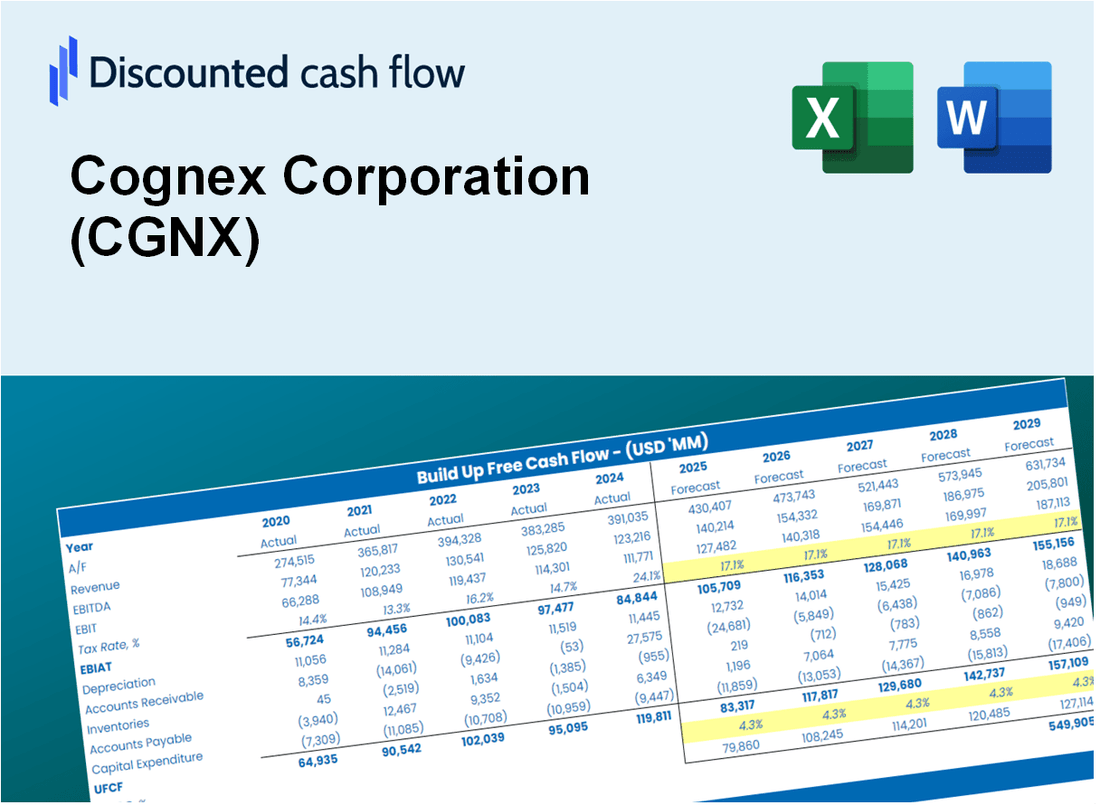
Coggex Corporation (CGNX) DCF -Bewertung |
Fully Editable: Tailor To Your Needs In Excel Or Sheets
Professional Design: Trusted, Industry-Standard Templates
Investor-Approved Valuation Models
MAC/PC Compatible, Fully Unlocked
No Expertise Is Needed; Easy To Follow
Cognex Corporation (CGNX) Bundle
Möchten Sie den inneren Wert der Cognex Corporation bestimmen? Unser CGNX DCF-Taschenrechner integriert reale Daten mit umfangreichen Anpassungsfunktionen, sodass Sie Prognosen anpassen und fundiertere Investitionsauswahlmöglichkeiten treffen können.
What You Will Get
- Real CGNX Financial Data: Pre-filled with Cognex Corporation’s historical and projected data for precise analysis.
- Fully Editable Template: Modify key inputs like revenue growth, WACC, and EBITDA % with ease.
- Automatic Calculations: See Cognex’s intrinsic value update instantly based on your changes.
- Professional Valuation Tool: Designed for investors, analysts, and consultants seeking accurate DCF results.
- User-Friendly Design: Simple structure and clear instructions for all experience levels.
Key Features
- 🔍 Real-Life CGNX Financials: Pre-filled historical and projected data for Cognex Corporation (CGNX).
- ✏️ Fully Customizable Inputs: Adjust all critical parameters (yellow cells) like WACC, growth %, and tax rates.
- 📊 Professional DCF Valuation: Built-in formulas calculate Cognex’s intrinsic value using the Discounted Cash Flow method.
- ⚡ Instant Results: Visualize Cognex’s valuation instantly after making changes.
- Scenario Analysis: Test and compare outcomes for various financial assumptions side-by-side.
How It Works
- Step 1: Download the Excel file.
- Step 2: Review pre-entered Cognex Corporation (CGNX) data (historical and projected).
- Step 3: Adjust key assumptions (yellow cells) based on your analysis.
- Step 4: View automatic recalculations for Cognex Corporation’s intrinsic value.
- Step 5: Use the outputs for investment decisions or reporting.
Why Choose This Calculator for Cognex Corporation (CGNX)?
- All-in-One Solution: Combines DCF, WACC, and financial ratio analyses tailored for Cognex Corporation (CGNX).
- Flexible Parameters: Modify the highlighted cells to explore different financial scenarios for Cognex Corporation (CGNX).
- In-Depth Analysis: Automatically computes Cognex Corporation’s (CGNX) intrinsic value and Net Present Value.
- Preloaded Information: Access historical and projected data for a solid foundation in your analysis.
- Expert-Level Tool: Perfect for financial analysts, investors, and consultants focusing on Cognex Corporation (CGNX).
Who Should Use This Product?
- Individual Investors: Make informed decisions about buying or selling Cognex Corporation (CGNX) stock.
- Financial Analysts: Streamline valuation processes with ready-to-use financial models specific to Cognex Corporation (CGNX).
- Consultants: Deliver professional valuation insights for Cognex Corporation (CGNX) to clients quickly and accurately.
- Business Owners: Understand how technology companies like Cognex Corporation (CGNX) are valued to guide your own strategy.
- Finance Students: Learn valuation techniques using real-world data and scenarios related to Cognex Corporation (CGNX).
What the Template Contains
- Preloaded CGNX Data: Historical and projected financial data, including revenue, EBIT, and capital expenditures.
- DCF and WACC Models: Professional-grade sheets for calculating intrinsic value and Weighted Average Cost of Capital.
- Editable Inputs: Yellow-highlighted cells for adjusting revenue growth, tax rates, and discount rates.
- Financial Statements: Comprehensive annual and quarterly financials for deeper analysis.
- Key Ratios: Profitability, leverage, and efficiency ratios to evaluate performance.
- Dashboard and Charts: Visual summaries of valuation outcomes and assumptions.
Disclaimer
All information, articles, and product details provided on this website are for general informational and educational purposes only. We do not claim any ownership over, nor do we intend to infringe upon, any trademarks, copyrights, logos, brand names, or other intellectual property mentioned or depicted on this site. Such intellectual property remains the property of its respective owners, and any references here are made solely for identification or informational purposes, without implying any affiliation, endorsement, or partnership.
We make no representations or warranties, express or implied, regarding the accuracy, completeness, or suitability of any content or products presented. Nothing on this website should be construed as legal, tax, investment, financial, medical, or other professional advice. In addition, no part of this site—including articles or product references—constitutes a solicitation, recommendation, endorsement, advertisement, or offer to buy or sell any securities, franchises, or other financial instruments, particularly in jurisdictions where such activity would be unlawful.
All content is of a general nature and may not address the specific circumstances of any individual or entity. It is not a substitute for professional advice or services. Any actions you take based on the information provided here are strictly at your own risk. You accept full responsibility for any decisions or outcomes arising from your use of this website and agree to release us from any liability in connection with your use of, or reliance upon, the content or products found herein.