
|
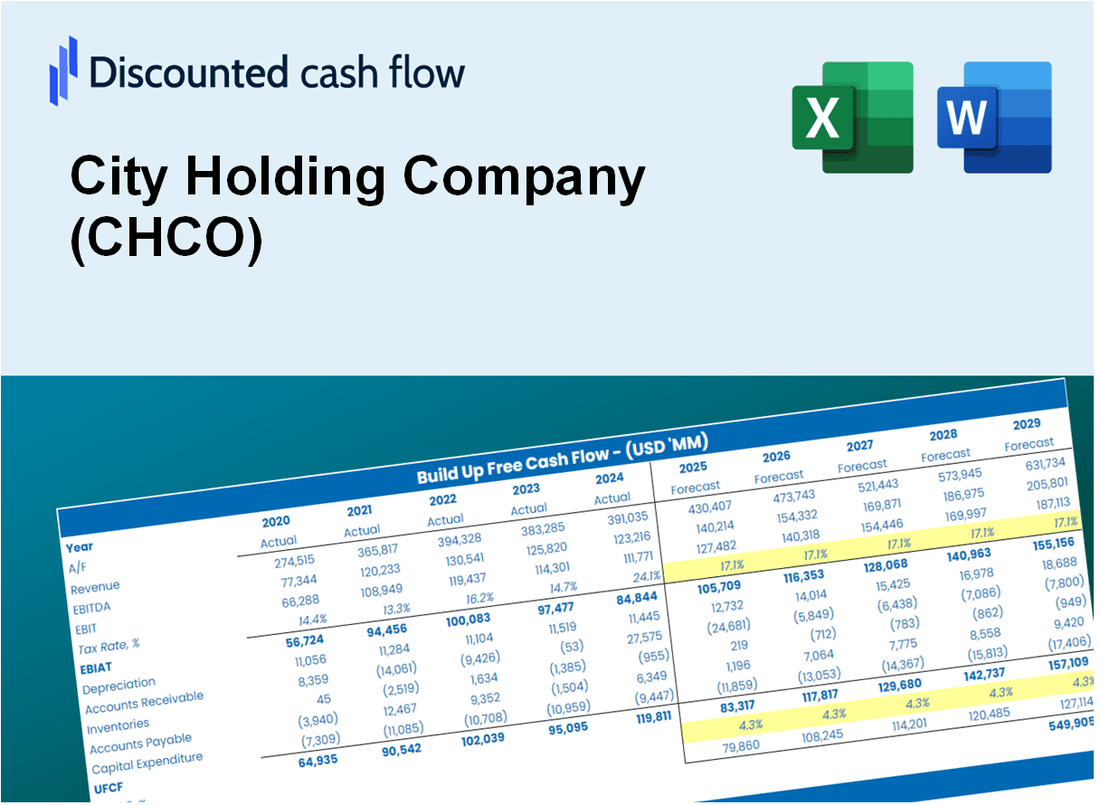
DCF -Bewertung der Stadt Holding (CHCO) |
Fully Editable: Tailor To Your Needs In Excel Or Sheets
Professional Design: Trusted, Industry-Standard Templates
Investor-Approved Valuation Models
MAC/PC Compatible, Fully Unlocked
No Expertise Is Needed; Easy To Follow
City Holding Company (CHCO) Bundle
Bewerten Sie die finanziellen Aussichten der City Holding Company (CHCO) wie ein Experte! Dieser (CHCO) DCF-Taschenrechner bietet Ihnen vorgefüllte Finanzdaten und vollständige Flexibilität, um das Umsatzwachstum, WACC, Margen und andere wesentliche Annahmen zu ändern, um sich an Ihren Prognosen auszurichten.
Discounted Cash Flow (DCF) - (USD MM)
| Year | AY1 2020 |
AY2 2021 |
AY3 2022 |
AY4 2023 |
AY5 2024 |
FY1 2025 |
FY2 2026 |
FY3 2027 |
FY4 2028 |
FY5 2029 |
|---|---|---|---|---|---|---|---|---|---|---|
| Revenue | 255.0 | 228.7 | 255.7 | 334.4 | 371.3 | 411.4 | 455.9 | 505.3 | 559.9 | 620.5 |
| Revenue Growth, % | 0 | -10.35 | 11.84 | 30.78 | 11.01 | 10.82 | 10.82 | 10.82 | 10.82 | 10.82 |
| EBITDA | 122.0 | 125.8 | 143.1 | 153.8 | 157.7 | 203.5 | 225.5 | 249.9 | 276.9 | 306.9 |
| EBITDA, % | 47.83 | 55.02 | 55.96 | 45.99 | 42.48 | 49.46 | 49.46 | 49.46 | 49.46 | 49.46 |
| Depreciation | 10.7 | 14.6 | 15.8 | 10.7 | 13.2 | 19.3 | 21.4 | 23.8 | 26.3 | 29.2 |
| Depreciation, % | 4.18 | 6.39 | 6.17 | 3.21 | 3.56 | 4.7 | 4.7 | 4.7 | 4.7 | 4.7 |
| EBIT | 111.3 | 111.2 | 127.3 | 143.1 | 144.5 | 184.1 | 204.1 | 226.1 | 250.6 | 277.7 |
| EBIT, % | 43.64 | 48.63 | 49.79 | 42.79 | 38.93 | 44.76 | 44.76 | 44.76 | 44.76 | 44.76 |
| Total Cash | 1,707.4 | 2,042.8 | 1,705.5 | 1,494.4 | 240.8 | 382.5 | 423.9 | 469.8 | 520.6 | 576.9 |
| Total Cash, percent | .0 | .0 | .0 | .0 | .0 | .0 | .0 | .0 | .0 | .0 |
| Account Receivables | 15.8 | 15.6 | 18.3 | 20.3 | 20.7 | 26.2 | 29.0 | 32.1 | 35.6 | 39.5 |
| Account Receivables, % | 6.19 | 6.83 | 7.15 | 6.07 | 5.56 | 6.36 | 6.36 | 6.36 | 6.36 | 6.36 |
| Inventories | .0 | .0 | .0 | .0 | .0 | .0 | .0 | .0 | .0 | .0 |
| Inventories, % | 0 | 0 | 0 | 0 | 0 | 0 | 0 | 0 | 0 | 0 |
| Accounts Payable | .0 | .0 | .0 | .0 | .0 | .0 | .0 | .0 | .0 | .0 |
| Accounts Payable, % | 0 | 0 | 0 | 0 | 0 | 0 | 0 | 0 | 0 | 0 |
| Capital Expenditure | -5.5 | -3.3 | -2.1 | -3.0 | -2.7 | -5.0 | -5.5 | -6.1 | -6.8 | -7.5 |
| Capital Expenditure, % | -2.17 | -1.45 | -0.8372 | -0.88564 | -0.72888 | -1.22 | -1.22 | -1.22 | -1.22 | -1.22 |
| Tax Rate, % | 18.97 | 18.97 | 18.97 | 18.97 | 18.97 | 18.97 | 18.97 | 18.97 | 18.97 | 18.97 |
| EBITAT | 89.6 | 88.1 | 102.1 | 114.4 | 117.1 | 147.6 | 163.6 | 181.3 | 200.9 | 222.6 |
| Depreciation | ||||||||||
| Changes in Account Receivables | ||||||||||
| Changes in Inventories | ||||||||||
| Changes in Accounts Payable | ||||||||||
| Capital Expenditure | ||||||||||
| UFCF | 78.9 | 99.5 | 113.0 | 120.1 | 127.2 | 156.4 | 176.6 | 195.8 | 216.9 | 240.4 |
| WACC, % | 7.98 | 7.93 | 7.97 | 7.96 | 8 | 7.97 | 7.97 | 7.97 | 7.97 | 7.97 |
| PV UFCF | ||||||||||
| SUM PV UFCF | 775.4 | |||||||||
| Long Term Growth Rate, % | 2.00 | |||||||||
| Free cash flow (T + 1) | 245 | |||||||||
| Terminal Value | 4,108 | |||||||||
| Present Terminal Value | 2,800 | |||||||||
| Enterprise Value | 3,576 | |||||||||
| Net Debt | 250 | |||||||||
| Equity Value | 3,325 | |||||||||
| Diluted Shares Outstanding, MM | 15 | |||||||||
| Equity Value Per Share | 226.26 |
What You Will Get
- Real CHCO Financial Data: Pre-filled with City Holding Company’s historical and projected data for precise analysis.
- Fully Editable Template: Modify key inputs like revenue growth, WACC, and EBITDA % with ease.
- Automatic Calculations: See City Holding Company’s intrinsic value update instantly based on your changes.
- Professional Valuation Tool: Designed for investors, analysts, and consultants seeking accurate DCF results.
- User-Friendly Design: Simple structure and clear instructions for all experience levels.
Key Features
- Customizable Financial Inputs: Adjust essential variables such as loan growth, net interest margin, and operating expenses.
- Instant DCF Valuation: Quickly computes intrinsic value, NPV, and additional financial metrics.
- High-Precision Accuracy: Leverages City Holding Company's (CHCO) actual financial data for dependable valuation results.
- Effortless Scenario Testing: Easily evaluate various assumptions and analyze the resulting impacts.
- Efficiency Booster: Avoid the complexities of creating detailed valuation models from the ground up.
How It Works
- Step 1: Download the prebuilt Excel template featuring City Holding Company's (CHCO) data.
- Step 2: Navigate through the pre-filled sheets to familiarize yourself with the essential metrics.
- Step 3: Adjust forecasts and assumptions in the editable yellow cells (WACC, growth, margins).
- Step 4: Instantly view the updated results, including City Holding Company's (CHCO) intrinsic value.
- Step 5: Make well-informed investment decisions or create reports based on the outputs.
Why Choose This Calculator for City Holding Company (CHCO)?
- Accuracy: Utilizes real City Holding Company financials for precise data.
- Flexibility: Tailored for users to easily test and adjust inputs.
- Time-Saving: Eliminate the need to create a DCF model from the ground up.
- Professional-Grade: Crafted with the expertise and usability expected by CFOs.
- User-Friendly: Intuitive interface designed for users of all financial backgrounds.
Who Should Use This Product?
- Finance Students: Master financial analysis techniques and apply them using real data from City Holding Company (CHCO).
- Academics: Integrate industry-standard models into your curriculum or research focused on City Holding Company (CHCO).
- Investors: Validate your investment hypotheses and evaluate performance metrics for City Holding Company (CHCO).
- Analysts: Enhance your efficiency with a ready-to-use, customizable DCF model tailored for City Holding Company (CHCO).
- Small Business Owners: Understand the analytical methods used to evaluate large public companies like City Holding Company (CHCO).
What the Template Contains
- Historical Data: Includes City Holding Company's (CHCO) past financials and baseline forecasts.
- DCF and Levered DCF Models: Detailed templates to calculate City Holding Company's (CHCO) intrinsic value.
- WACC Sheet: Pre-built calculations for Weighted Average Cost of Capital.
- Editable Inputs: Modify key drivers like growth rates, EBITDA %, and CAPEX assumptions.
- Quarterly and Annual Statements: A complete breakdown of City Holding Company's (CHCO) financials.
- Interactive Dashboard: Visualize valuation results and projections dynamically.
Disclaimer
All information, articles, and product details provided on this website are for general informational and educational purposes only. We do not claim any ownership over, nor do we intend to infringe upon, any trademarks, copyrights, logos, brand names, or other intellectual property mentioned or depicted on this site. Such intellectual property remains the property of its respective owners, and any references here are made solely for identification or informational purposes, without implying any affiliation, endorsement, or partnership.
We make no representations or warranties, express or implied, regarding the accuracy, completeness, or suitability of any content or products presented. Nothing on this website should be construed as legal, tax, investment, financial, medical, or other professional advice. In addition, no part of this site—including articles or product references—constitutes a solicitation, recommendation, endorsement, advertisement, or offer to buy or sell any securities, franchises, or other financial instruments, particularly in jurisdictions where such activity would be unlawful.
All content is of a general nature and may not address the specific circumstances of any individual or entity. It is not a substitute for professional advice or services. Any actions you take based on the information provided here are strictly at your own risk. You accept full responsibility for any decisions or outcomes arising from your use of this website and agree to release us from any liability in connection with your use of, or reliance upon, the content or products found herein.