
|
Traeger, Inc. (Cook) DCF -Bewertung |
Fully Editable: Tailor To Your Needs In Excel Or Sheets
Professional Design: Trusted, Industry-Standard Templates
Investor-Approved Valuation Models
MAC/PC Compatible, Fully Unlocked
No Expertise Is Needed; Easy To Follow
Traeger, Inc. (COOK) Bundle
Unabhängig davon, ob Sie ein Investor oder Analyst sind, ist dieser Cook DCF -Taschenrechner Ihr wesentliches Werkzeug für eine genaue Bewertung. Mit Traeger, Inc. Real Data können Sie Prognosen anpassen und die Effekte in Echtzeit beobachten.
What You Will Get
- Editable Excel Template: A fully customizable Excel-based DCF Calculator featuring pre-filled real Traeger, Inc. (COOK) financials.
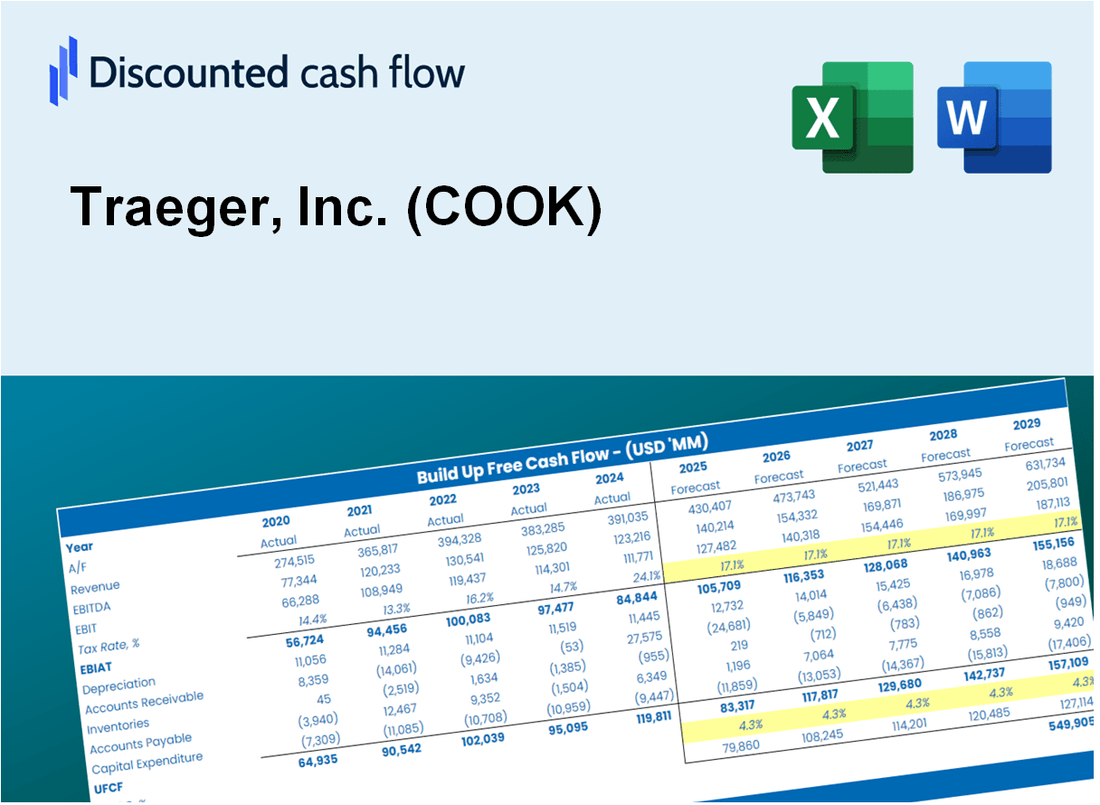
- Real-World Data: Historical data and forward-looking estimates (highlighted in the yellow cells).
- Forecast Flexibility: Adjust forecast assumptions such as revenue growth, EBITDA %, and WACC.
- Automatic Calculations: Instantly observe the effects of your inputs on Traeger, Inc.'s (COOK) valuation.
- Professional Tool: Designed for investors, CFOs, consultants, and financial analysts.
- User-Friendly Design: Organized for clarity and ease of use, complete with step-by-step instructions.
Key Features
- Real Traeger Financials: Access accurate pre-loaded historical data and future projections for Traeger, Inc. (COOK).
- Customizable Forecast Assumptions: Edit yellow-highlighted cells such as WACC, growth rates, and margins to tailor your analysis.
- Dynamic Calculations: Automatic updates to DCF, Net Present Value (NPV), and cash flow analysis for precise financial insights.
- Visual Dashboard: User-friendly charts and summaries to effectively visualize your valuation results.
- For Professionals and Beginners: A straightforward, intuitive layout designed for investors, CFOs, and consultants alike.
How It Works
- Download: Access the ready-to-use Excel file containing Traeger, Inc.'s (COOK) financial data.
- Customize: Modify forecasts, including revenue growth, EBITDA %, and WACC.
- Update Automatically: The intrinsic value and NPV calculations refresh in real-time.
- Test Scenarios: Develop multiple projections and instantly compare results.
- Make Decisions: Utilize the valuation outcomes to inform your investment strategy.
Why Choose This Calculator for Traeger, Inc. (COOK)?
- All-in-One Solution: Combines DCF, WACC, and financial ratio analyses tailored for Traeger, Inc. (COOK).
- Flexible Inputs: Modify yellow-highlighted cells to explore different financial scenarios.
- In-Depth Analysis: Automatically computes Traeger, Inc. (COOK)’s intrinsic value and Net Present Value.
- Data-Rich Environment: Features historical and projected data for reliable analysis.
- Expert-Level Tool: Perfect for financial analysts, investors, and business advisors focusing on Traeger, Inc. (COOK).
Who Should Use This Product?
- Professional Investors: Develop comprehensive and reliable valuation models for analyzing investments in Traeger, Inc. (COOK).
- Corporate Finance Teams: Evaluate valuation scenarios to inform strategic decisions within the company.
- Consultants and Advisors: Offer clients precise valuation insights regarding Traeger, Inc. (COOK) stock.
- Students and Educators: Utilize real-world data to enhance learning and practice in financial modeling.
- Outdoor Cooking Enthusiasts: Gain insights into how companies like Traeger, Inc. (COOK) are valued in the grilling and outdoor cooking market.
What the Template Contains
- Pre-Filled DCF Model: Traeger’s financial data preloaded for immediate use.
- WACC Calculator: Detailed calculations for Weighted Average Cost of Capital.
- Financial Ratios: Evaluate Traeger’s profitability, leverage, and efficiency.
- Editable Inputs: Change assumptions such as growth, margins, and CAPEX to fit your scenarios.
- Financial Statements: Annual and quarterly reports to support detailed analysis.
- Interactive Dashboard: Easily visualize key valuation metrics and results.
Disclaimer
All information, articles, and product details provided on this website are for general informational and educational purposes only. We do not claim any ownership over, nor do we intend to infringe upon, any trademarks, copyrights, logos, brand names, or other intellectual property mentioned or depicted on this site. Such intellectual property remains the property of its respective owners, and any references here are made solely for identification or informational purposes, without implying any affiliation, endorsement, or partnership.
We make no representations or warranties, express or implied, regarding the accuracy, completeness, or suitability of any content or products presented. Nothing on this website should be construed as legal, tax, investment, financial, medical, or other professional advice. In addition, no part of this site—including articles or product references—constitutes a solicitation, recommendation, endorsement, advertisement, or offer to buy or sell any securities, franchises, or other financial instruments, particularly in jurisdictions where such activity would be unlawful.
All content is of a general nature and may not address the specific circumstances of any individual or entity. It is not a substitute for professional advice or services. Any actions you take based on the information provided here are strictly at your own risk. You accept full responsibility for any decisions or outcomes arising from your use of this website and agree to release us from any liability in connection with your use of, or reliance upon, the content or products found herein.