
|
Mr. Cooper Group Inc. (Coop) DCF -Bewertung |
Fully Editable: Tailor To Your Needs In Excel Or Sheets
Professional Design: Trusted, Industry-Standard Templates
Investor-Approved Valuation Models
MAC/PC Compatible, Fully Unlocked
No Expertise Is Needed; Easy To Follow
Mr. Cooper Group Inc. (COOP) Bundle
Vereinfachen Sie die Bewertung der Mr. Cooper Group Inc. (Coop) mit diesem anpassbaren DCF -Taschenrechner! Mit Real Mr. Cooper Group Inc. (CoOP) -Befinanzierungen und einstellbaren Prognoseeingaben können Sie Szenarien testen und die beizulegende Zeit des Mr. Cooper Group Inc. (Coop) in Minuten aufdecken.
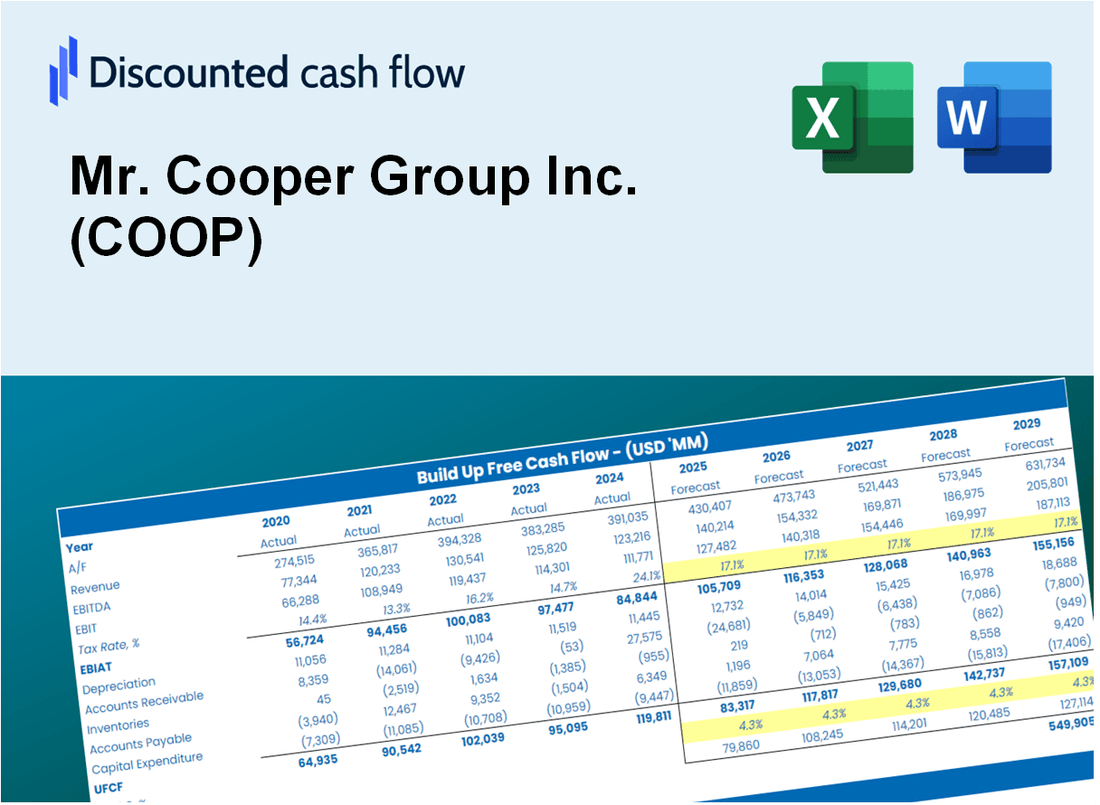
Discounted Cash Flow (DCF) - (USD MM)
| Year | AY1 2020 |
AY2 2021 |
AY3 2022 |
AY4 2023 |
AY5 2024 |
FY1 2025 |
FY2 2026 |
FY3 2027 |
FY4 2028 |
FY5 2029 |
|---|---|---|---|---|---|---|---|---|---|---|
| Revenue | 2,407.0 | 3,194.0 | 2,464.0 | 1,794.0 | 2,225.0 | 2,262.1 | 2,299.9 | 2,338.2 | 2,377.3 | 2,416.9 |
| Revenue Growth, % | 0 | 32.7 | -22.86 | -27.19 | 24.02 | 1.67 | 1.67 | 1.67 | 1.67 | 1.67 |
| EBITDA | 1,053.0 | 1,466.0 | 1,064.0 | 699.0 | 989.0 | 978.3 | 994.6 | 1,011.2 | 1,028.1 | 1,045.3 |
| EBITDA, % | 43.75 | 45.9 | 43.18 | 38.96 | 44.45 | 43.25 | 43.25 | 43.25 | 43.25 | 43.25 |
| Depreciation | 73.0 | 57.0 | 37.0 | 38.0 | 44.0 | 47.1 | 47.9 | 48.7 | 49.5 | 50.3 |
| Depreciation, % | 3.03 | 1.78 | 1.5 | 2.12 | 1.98 | 2.08 | 2.08 | 2.08 | 2.08 | 2.08 |
| EBIT | 980.0 | 1,409.0 | 1,027.0 | 661.0 | 945.0 | 931.2 | 946.7 | 962.5 | 978.6 | 994.9 |
| EBIT, % | 40.71 | 44.11 | 41.68 | 36.85 | 42.47 | 41.17 | 41.17 | 41.17 | 41.17 | 41.17 |
| Total Cash | 695.0 | 895.0 | 527.0 | 571.0 | 753.0 | 651.3 | 662.2 | 673.2 | 684.4 | 695.9 |
| Total Cash, percent | .0 | .0 | .0 | .0 | .0 | .0 | .0 | .0 | .0 | .0 |
| Account Receivables | 6,193.0 | 1,228.0 | 1,019.0 | 996.0 | 1,345.0 | 1,338.1 | 1,360.5 | 1,383.2 | 1,406.2 | 1,429.7 |
| Account Receivables, % | 257.29 | 38.45 | 41.36 | 55.52 | 60.45 | 59.15 | 59.15 | 59.15 | 59.15 | 59.15 |
| Inventories | .0 | .0 | .0 | .0 | .0 | .0 | .0 | .0 | .0 | .0 |
| Inventories, % | 0 | 0 | 0 | 0 | 0 | 0 | 0 | 0 | 0 | 0 |
| Accounts Payable | 7,159.0 | 2,392.0 | 2,633.0 | 1,995.0 | 2,322.0 | 2,148.5 | 2,184.4 | 2,220.8 | 2,257.9 | 2,295.5 |
| Accounts Payable, % | 297.42 | 74.89 | 106.86 | 111.2 | 104.36 | 94.98 | 94.98 | 94.98 | 94.98 | 94.98 |
| Capital Expenditure | -187.0 | -963.0 | -1,612.0 | -1,868.0 | -38.0 | -927.7 | -943.2 | -958.9 | -974.9 | -991.2 |
| Capital Expenditure, % | -7.77 | -30.15 | -65.42 | -104.12 | -1.71 | -41.01 | -41.01 | -41.01 | -41.01 | -41.01 |
| Tax Rate, % | 25.75 | 25.75 | 25.75 | 25.75 | 25.75 | 25.75 | 25.75 | 25.75 | 25.75 | 25.75 |
| EBITAT | 743.5 | 1,057.7 | 780.8 | 505.4 | 701.7 | 703.4 | 715.1 | 727.0 | 739.2 | 751.5 |
| Depreciation | ||||||||||
| Changes in Account Receivables | ||||||||||
| Changes in Inventories | ||||||||||
| Changes in Accounts Payable | ||||||||||
| Capital Expenditure | ||||||||||
| UFCF | 1,595.5 | 349.7 | -344.2 | -1,939.6 | 685.7 | -343.8 | -166.6 | -169.4 | -172.2 | -175.1 |
| WACC, % | 6 | 5.99 | 6 | 6.01 | 5.97 | 5.99 | 5.99 | 5.99 | 5.99 | 5.99 |
| PV UFCF | ||||||||||
| SUM PV UFCF | -882.3 | |||||||||
| Long Term Growth Rate, % | 2.00 | |||||||||
| Free cash flow (T + 1) | -179 | |||||||||
| Terminal Value | -4,473 | |||||||||
| Present Terminal Value | -3,343 | |||||||||
| Enterprise Value | -4,226 | |||||||||
| Net Debt | 10,633 | |||||||||
| Equity Value | -14,859 | |||||||||
| Diluted Shares Outstanding, MM | 66 | |||||||||
| Equity Value Per Share | -226.22 |
What You Will Get
- Real Mr. Cooper Data: Preloaded financials – encompassing revenue to EBIT – based on both actual and projected figures.
- Full Customization: Modify all essential parameters (yellow cells) such as WACC, growth %, and tax rates.
- Instant Valuation Updates: Automatic recalculations to assess the impact of changes on Mr. Cooper’s fair value.
- Versatile Excel Template: Designed for quick edits, scenario testing, and comprehensive projections.
- Time-Saving and Accurate: Avoid the hassle of building models from scratch while ensuring precision and flexibility.
Key Features
- Comprehensive Financial Data: Gain access to precise pre-loaded historical figures and future forecasts for Mr. Cooper Group Inc. (COOP).
- Adjustable Forecast Parameters: Modify the highlighted cells for metrics like WACC, growth rates, and profit margins.
- Real-Time Calculations: Enjoy automatic updates for DCF, Net Present Value (NPV), and cash flow assessments.
- User-Friendly Dashboard: Clear charts and summaries to help you visualize your valuation outcomes.
- Designed for All Levels: An intuitive layout tailored for investors, CFOs, and consultants alike.
How It Works
- Step 1: Download the Excel file.
- Step 2: Review pre-entered Mr. Cooper Group Inc. (COOP) data (historical and projected).
- Step 3: Adjust key assumptions (yellow cells) based on your analysis.
- Step 4: View automatic recalculations for Mr. Cooper Group Inc.'s intrinsic value.
- Step 5: Use the outputs for investment decisions or reporting.
Why Choose Mr. Cooper Group Inc. (COOP)?
- Save Time: Quickly access comprehensive mortgage solutions without the hassle of lengthy processes.
- Enhance Accuracy: Dependable data and tools ensure precise calculations for your financial needs.
- Fully Customizable: Adjust services and products to meet your unique home financing requirements.
- User-Friendly Interface: Intuitive design allows for effortless navigation and understanding of options.
- Endorsed by Industry Leaders: Recognized by professionals for its commitment to quality and customer satisfaction.
Who Should Use This Product?
- Real Estate Investors: Develop comprehensive and accurate valuation models for property analysis.
- Mortgage Finance Teams: Assess valuation scenarios to inform lending strategies.
- Consultants and Advisors: Deliver precise valuation insights for Mr. Cooper Group Inc. (COOP) to clients.
- Students and Educators: Utilize real-world data to enhance learning and practice in financial modeling.
- Finance Enthusiasts: Gain insights into how mortgage companies like Mr. Cooper Group Inc. (COOP) are valued in the financial market.
What the Template Contains
- Preloaded COOP Data: Historical and projected financial data, including revenue, EBIT, and capital expenditures.
- DCF and WACC Models: Professional-grade sheets for calculating intrinsic value and Weighted Average Cost of Capital.
- Editable Inputs: Yellow-highlighted cells for adjusting revenue growth, tax rates, and discount rates.
- Financial Statements: Comprehensive annual and quarterly financials for deeper analysis.
- Key Ratios: Profitability, leverage, and efficiency ratios to evaluate performance.
- Dashboard and Charts: Visual summaries of valuation outcomes and assumptions.
Disclaimer
All information, articles, and product details provided on this website are for general informational and educational purposes only. We do not claim any ownership over, nor do we intend to infringe upon, any trademarks, copyrights, logos, brand names, or other intellectual property mentioned or depicted on this site. Such intellectual property remains the property of its respective owners, and any references here are made solely for identification or informational purposes, without implying any affiliation, endorsement, or partnership.
We make no representations or warranties, express or implied, regarding the accuracy, completeness, or suitability of any content or products presented. Nothing on this website should be construed as legal, tax, investment, financial, medical, or other professional advice. In addition, no part of this site—including articles or product references—constitutes a solicitation, recommendation, endorsement, advertisement, or offer to buy or sell any securities, franchises, or other financial instruments, particularly in jurisdictions where such activity would be unlawful.
All content is of a general nature and may not address the specific circumstances of any individual or entity. It is not a substitute for professional advice or services. Any actions you take based on the information provided here are strictly at your own risk. You accept full responsibility for any decisions or outcomes arising from your use of this website and agree to release us from any liability in connection with your use of, or reliance upon, the content or products found herein.