
|
Compass Group PLC (CPG.L) DCF -Bewertung |
Fully Editable: Tailor To Your Needs In Excel Or Sheets
Professional Design: Trusted, Industry-Standard Templates
Investor-Approved Valuation Models
MAC/PC Compatible, Fully Unlocked
No Expertise Is Needed; Easy To Follow
Compass Group PLC (CPG.L) Bundle
Entdecken Sie die finanzielle Zukunft von Compass Group PLC (CPGL) mit unserem benutzerfreundlichen DCF-Taschenrechner! Geben Sie Ihre Annahmen in Bezug auf Wachstum, Margen und Ausgaben ein, um den inneren Wert der Compass Group PLC (CPGL) zu berechnen und Ihre Anlagestrategie zu verfeinern.
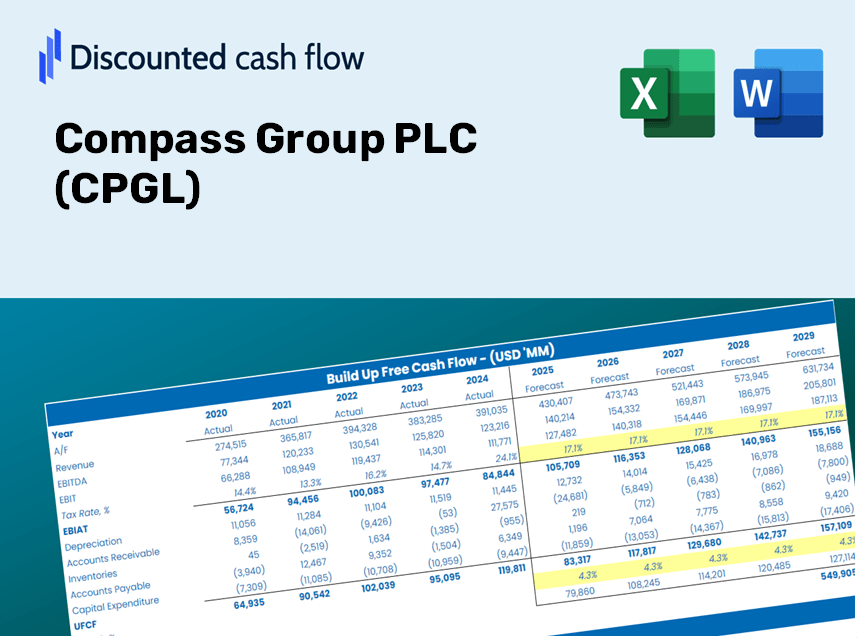
Discounted Cash Flow (DCF) - (USD MM)
| Year | AY1 2020 |
AY2 2021 |
AY3 2022 |
AY4 2023 |
AY5 2024 |
FY1 2025 |
FY2 2026 |
FY3 2027 |
FY4 2028 |
FY5 2029 |
|---|---|---|---|---|---|---|---|---|---|---|
| Revenue | 19,940.0 | 17,908.0 | 25,512.0 | 31,028.0 | 42,002.0 | 51,374.8 | 62,839.1 | 76,861.6 | 94,013.3 | 114,992.4 |
| Revenue Growth, % | 0 | -10.19 | 42.46 | 21.62 | 35.37 | 22.32 | 22.32 | 22.32 | 22.32 | 22.32 |
| EBITDA | 915.0 | 1,283.0 | 2,351.0 | 2,743.0 | 2,761.5 | 3,738.4 | 4,572.6 | 5,593.0 | 6,841.1 | 8,367.6 |
| EBITDA, % | 4.59 | 7.16 | 9.22 | 8.84 | 6.57 | 7.28 | 7.28 | 7.28 | 7.28 | 7.28 |
| Depreciation | 818.0 | 765.0 | 821.0 | 880.0 | 956.3 | 1,716.4 | 2,099.5 | 2,568.0 | 3,141.0 | 3,841.9 |
| Depreciation, % | 4.1 | 4.27 | 3.22 | 2.84 | 2.28 | 3.34 | 3.34 | 3.34 | 3.34 | 3.34 |
| EBIT | 97.0 | 518.0 | 1,530.0 | 1,863.0 | 1,805.2 | 2,021.9 | 2,473.1 | 3,025.0 | 3,700.1 | 4,525.7 |
| EBIT, % | 0.48646 | 2.89 | 6 | 6 | 4.3 | 3.94 | 3.94 | 3.94 | 3.94 | 3.94 |
| Total Cash | 1,484.0 | 1,842.0 | 1,988.0 | 1,029.0 | 623.0 | 3,115.4 | 3,810.6 | 4,660.9 | 5,701.0 | 6,973.2 |
| Total Cash, percent | .0 | .0 | .0 | .0 | .0 | .0 | .0 | .0 | .0 | .0 |
| Account Receivables | 2,853.2 | 2,652.0 | 3,941.0 | 4,899.0 | 5,421.0 | 7,527.5 | 9,207.3 | 11,261.9 | 13,775.0 | 16,848.9 |
| Account Receivables, % | 14.31 | 14.81 | 15.45 | 15.79 | 12.91 | 14.65 | 14.65 | 14.65 | 14.65 | 14.65 |
| Inventories | 310.0 | 327.0 | 511.0 | 692.0 | 734.0 | 961.9 | 1,176.5 | 1,439.1 | 1,760.2 | 2,153.0 |
| Inventories, % | 1.55 | 1.83 | 2 | 2.23 | 1.75 | 1.87 | 1.87 | 1.87 | 1.87 | 1.87 |
| Accounts Payable | 1,113.0 | 1,418.0 | 2,292.0 | 2,940.0 | 3,317.0 | 4,095.2 | 5,009.1 | 6,126.9 | 7,494.1 | 9,166.4 |
| Accounts Payable, % | 5.58 | 7.92 | 8.98 | 9.48 | 7.9 | 7.97 | 7.97 | 7.97 | 7.97 | 7.97 |
| Capital Expenditure | -709.0 | -228.0 | -282.0 | -365.0 | -901.0 | -951.0 | -1,163.2 | -1,422.8 | -1,740.3 | -2,128.7 |
| Capital Expenditure, % | -3.56 | -1.27 | -1.11 | -1.18 | -2.15 | -1.85 | -1.85 | -1.85 | -1.85 | -1.85 |
| Tax Rate, % | 31.71 | 31.71 | 31.71 | 31.71 | 31.71 | 31.71 | 31.71 | 31.71 | 31.71 | 31.71 |
| EBITAT | 62.6 | 398.5 | 1,294.5 | 1,401.2 | 1,232.7 | 1,494.7 | 1,828.2 | 2,236.2 | 2,735.2 | 3,345.5 |
| Depreciation | ||||||||||
| Changes in Account Receivables | ||||||||||
| Changes in Inventories | ||||||||||
| Changes in Accounts Payable | ||||||||||
| Capital Expenditure | ||||||||||
| UFCF | -1,878.5 | 1,424.7 | 1,234.5 | 1,425.2 | 1,101.0 | 703.9 | 1,783.9 | 2,181.9 | 2,668.8 | 3,264.4 |
| WACC, % | 5.73 | 5.79 | 5.82 | 5.78 | 5.75 | 5.77 | 5.77 | 5.77 | 5.77 | 5.77 |
| PV UFCF | ||||||||||
| SUM PV UFCF | 8,701.2 | |||||||||
| Long Term Growth Rate, % | 2.00 | |||||||||
| Free cash flow (T + 1) | 3,330 | |||||||||
| Terminal Value | 88,220 | |||||||||
| Present Terminal Value | 66,630 | |||||||||
| Enterprise Value | 75,331 | |||||||||
| Net Debt | 5,288 | |||||||||
| Equity Value | 70,043 | |||||||||
| Diluted Shares Outstanding, MM | 1,707 | |||||||||
| Equity Value Per Share | 4,103.28 |
What You Will Receive
- Authentic CPGL Financial Data: Pre-populated with Compass Group PLC's historical and forecasted data for accurate analysis.
- Customizable Template: Easily adjust key inputs such as revenue growth, WACC, and EBITDA %.
- Instant Calculations: Watch the intrinsic value of Compass Group PLC update in real-time as you make changes.
- Expert Valuation Tool: Tailored for investors, analysts, and consultants who need precise DCF outcomes.
- User-Friendly Interface: A straightforward layout and clear guidelines suitable for all levels of expertise.
Key Features
- Real-Life CPGL Data: Pre-loaded with Compass Group PLC's historical financial figures and future projections.
- Fully Customizable Inputs: Modify revenue growth rates, profit margins, WACC, tax percentages, and capital spending.
- Dynamic Valuation Model: Automatically refreshes Net Present Value (NPV) and intrinsic value as per your adjustments.
- Scenario Testing: Develop various forecasting scenarios to explore different valuation results.
- User-Friendly Design: Intuitive, organized, and suitable for both professionals and novices.
How It Functions
- Step 1: Download the Excel file.
- Step 2: Examine Compass Group PLC's (CPGL) pre-filled financial data and projections.
- Step 3: Adjust key inputs such as revenue growth, WACC, and tax rates (highlighted cells).
- Step 4: Observe the DCF model refresh in real-time as you modify assumptions.
- Step 5: Evaluate the outputs and leverage the findings for investment strategies.
Why Opt for This Calculator?
- Comprehensive Functionality: Offers DCF, WACC, and financial ratio analyses all in one solution.
- Customizable Features: Modify the yellow-highlighted fields to explore different scenarios.
- In-Depth Analysis: Automatically determines the intrinsic value and Net Present Value of Compass Group PLC (CPGL).
- Preloaded Information: Historical and projected data provide reliable starting points for analysis.
- Professional Grade: Perfect for financial analysts, investors, and business consultants.
Who Can Benefit from This Product?
- Investors: Evaluate Compass Group PLC's (CPGL) valuation before making buying or selling decisions.
- CFOs and Financial Analysts: Enhance the efficiency of valuation processes and validate financial projections.
- Startup Founders: Understand the valuation methods used for prominent public companies like Compass Group PLC.
- Consultants: Create detailed valuation reports to present to clients.
- Students and Educators: Utilize real-world examples to practice and teach valuation methodologies.
Contents of the Template
- Operating and Balance Sheet Data: Pre-filled historical data and forecasts for Compass Group PLC (CPGL), including revenue, EBITDA, EBIT, and capital expenditures.
- WACC Calculation: A dedicated sheet for the Weighted Average Cost of Capital (WACC), featuring parameters such as Beta, risk-free rate, and share price.
- DCF Valuation (Unlevered and Levered): Customizable Discounted Cash Flow models that display intrinsic value with comprehensive calculations.
- Financial Statements: Pre-loaded annual and quarterly financial statements to aid in your analysis.
- Key Ratios: A collection of profitability, leverage, and efficiency ratios specific to Compass Group PLC (CPGL).
- Dashboard and Charts: Visual summaries of valuation outputs and assumptions for easy result analysis.
Disclaimer
All information, articles, and product details provided on this website are for general informational and educational purposes only. We do not claim any ownership over, nor do we intend to infringe upon, any trademarks, copyrights, logos, brand names, or other intellectual property mentioned or depicted on this site. Such intellectual property remains the property of its respective owners, and any references here are made solely for identification or informational purposes, without implying any affiliation, endorsement, or partnership.
We make no representations or warranties, express or implied, regarding the accuracy, completeness, or suitability of any content or products presented. Nothing on this website should be construed as legal, tax, investment, financial, medical, or other professional advice. In addition, no part of this site—including articles or product references—constitutes a solicitation, recommendation, endorsement, advertisement, or offer to buy or sell any securities, franchises, or other financial instruments, particularly in jurisdictions where such activity would be unlawful.
All content is of a general nature and may not address the specific circumstances of any individual or entity. It is not a substitute for professional advice or services. Any actions you take based on the information provided here are strictly at your own risk. You accept full responsibility for any decisions or outcomes arising from your use of this website and agree to release us from any liability in connection with your use of, or reliance upon, the content or products found herein.