
|
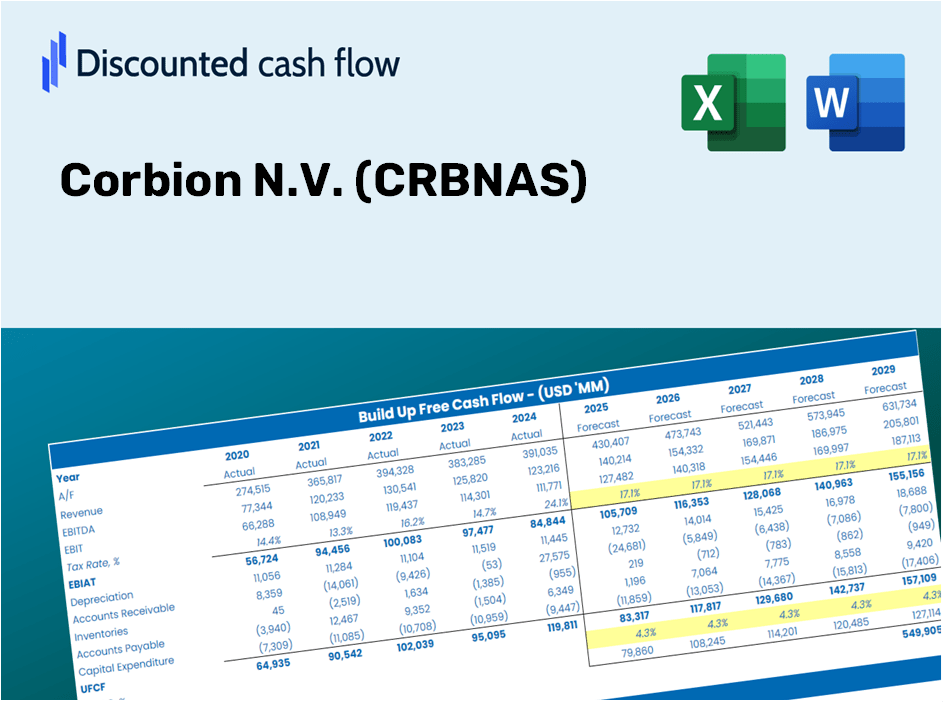
Corbion N. V. (CRBN.as) DCF -Bewertung |
Fully Editable: Tailor To Your Needs In Excel Or Sheets
Professional Design: Trusted, Industry-Standard Templates
Investor-Approved Valuation Models
MAC/PC Compatible, Fully Unlocked
No Expertise Is Needed; Easy To Follow
Corbion N.V. (CRBN.AS) Bundle
Entdecken Sie den finanziellen Ausblick von Corbion N. V. (CRBNAs) mit unserem benutzerfreundlichen DCF-Taschenrechner! Geben Sie Ihre Annahmen für Wachstum, Margen und Kosten ein, um den inneren Wert von Corbion N.V. (CRBNAs) zu berechnen und Ihre Anlagestrategie zu verfeinern.
Discounted Cash Flow (DCF) - (USD MM)
| Year | AY1 2020 |
AY2 2021 |
AY3 2022 |
AY4 2023 |
AY5 2024 |
FY1 2025 |
FY2 2026 |
FY3 2027 |
FY4 2028 |
FY5 2029 |
|---|---|---|---|---|---|---|---|---|---|---|
| Revenue | 986.5 | 1,070.8 | 1,457.9 | 1,443.8 | 1,288.1 | 1,394.2 | 1,509.0 | 1,633.3 | 1,767.8 | 1,913.4 |
| Revenue Growth, % | 0 | 8.55 | 36.15 | -0.96714 | -10.78 | 8.24 | 8.24 | 8.24 | 8.24 | 8.24 |
| EBITDA | 154.9 | 140.1 | 194.0 | 198.0 | 172.0 | 192.8 | 208.7 | 225.9 | 244.5 | 264.7 |
| EBITDA, % | 15.7 | 13.08 | 13.31 | 13.71 | 13.35 | 13.83 | 13.83 | 13.83 | 13.83 | 13.83 |
| Depreciation | 59.2 | 60.8 | 72.7 | 82.2 | 86.8 | 81.1 | 87.8 | 95.1 | 102.9 | 111.4 |
| Depreciation, % | 6 | 5.68 | 4.99 | 5.69 | 6.74 | 5.82 | 5.82 | 5.82 | 5.82 | 5.82 |
| EBIT | 95.7 | 79.3 | 121.3 | 115.8 | 85.2 | 111.7 | 120.9 | 130.9 | 141.6 | 153.3 |
| EBIT, % | 9.7 | 7.41 | 8.32 | 8.02 | 6.61 | 8.01 | 8.01 | 8.01 | 8.01 | 8.01 |
| Total Cash | 51.6 | 42.2 | 58.2 | 70.2 | 49.3 | 60.9 | 66.0 | 71.4 | 77.3 | 83.6 |
| Total Cash, percent | .0 | .0 | .0 | .0 | .0 | .0 | .0 | .0 | .0 | .0 |
| Account Receivables | 156.9 | 231.2 | 264.9 | 200.9 | 203.5 | 238.1 | 257.7 | 278.9 | 301.9 | 326.7 |
| Account Receivables, % | 15.9 | 21.59 | 18.17 | 13.91 | 15.8 | 17.08 | 17.08 | 17.08 | 17.08 | 17.08 |
| Inventories | 164.8 | 230.0 | 331.2 | 262.9 | 258.1 | 276.5 | 299.2 | 323.9 | 350.6 | 379.4 |
| Inventories, % | 16.71 | 21.48 | 22.72 | 18.21 | 20.04 | 19.83 | 19.83 | 19.83 | 19.83 | 19.83 |
| Accounts Payable | 99.4 | 128.0 | 148.3 | 104.3 | 105.3 | 132.7 | 143.7 | 155.5 | 168.3 | 182.2 |
| Accounts Payable, % | 10.08 | 11.95 | 10.17 | 7.22 | 8.17 | 9.52 | 9.52 | 9.52 | 9.52 | 9.52 |
| Capital Expenditure | -88.9 | -148.7 | -235.8 | -149.3 | -84.2 | -156.0 | -168.9 | -182.8 | -197.8 | -214.1 |
| Capital Expenditure, % | -9.01 | -13.89 | -16.17 | -10.34 | -6.54 | -11.19 | -11.19 | -11.19 | -11.19 | -11.19 |
| Tax Rate, % | -207.52 | -207.52 | -207.52 | -207.52 | -207.52 | -207.52 | -207.52 | -207.52 | -207.52 | -207.52 |
| EBITAT | 79.8 | 71.8 | 93.8 | 99.0 | 262.0 | 97.6 | 105.6 | 114.3 | 123.7 | 133.9 |
| Depreciation | ||||||||||
| Changes in Account Receivables | ||||||||||
| Changes in Inventories | ||||||||||
| Changes in Accounts Payable | ||||||||||
| Capital Expenditure | ||||||||||
| UFCF | -172.2 | -127.0 | -183.9 | 120.2 | 267.8 | -2.8 | -6.9 | -7.5 | -8.1 | -8.7 |
| WACC, % | 6.7 | 6.81 | 6.61 | 6.73 | 6.95 | 6.76 | 6.76 | 6.76 | 6.76 | 6.76 |
| PV UFCF | ||||||||||
| SUM PV UFCF | -27.4 | |||||||||
| Long Term Growth Rate, % | 2.00 | |||||||||
| Free cash flow (T + 1) | -9 | |||||||||
| Terminal Value | -187 | |||||||||
| Present Terminal Value | -135 | |||||||||
| Enterprise Value | -162 | |||||||||
| Net Debt | 460 | |||||||||
| Equity Value | -622 | |||||||||
| Diluted Shares Outstanding, MM | 59 | |||||||||
| Equity Value Per Share | -10.49 |
What You Will Receive
- Authentic Corbion Data: Preloaded financial information – from revenue to EBIT – based on real and projected figures.
- Comprehensive Customization: Modify all essential parameters (yellow cells) such as WACC, growth %, and tax rates.
- Immediate Valuation Adjustments: Automatic recalculations to assess the effects of changes on Corbion N.V.'s fair value.
- Flexible Excel Template: Designed for quick modifications, scenario analysis, and in-depth forecasts.
- Efficient and Precise: Avoid the hassle of building models from the ground up while ensuring accuracy and adaptability.
Key Features
- Comprehensive DCF Calculator: Offers detailed unlevered and levered DCF valuation models tailored for Corbion N.V. (CRBNAS).
- WACC Calculator: Comes with a pre-designed Weighted Average Cost of Capital sheet featuring customizable inputs.
- Customizable Forecast Assumptions: Adjust growth rates, capital expenditures, and discount rates as needed.
- Integrated Financial Ratios: Evaluate profitability, leverage, and efficiency ratios specifically for Corbion N.V. (CRBNAS).
- Interactive Dashboard and Charts: Visual representations that highlight essential valuation metrics for streamlined analysis.
How It Works
- Step 1: Download the prebuilt Excel template featuring Corbion N.V. (CRBNAS) data.
- Step 2: Review the pre-filled sheets to familiarize yourself with the essential metrics.
- Step 3: Modify forecasts and key assumptions in the editable yellow cells (WACC, growth, margins).
- Step 4: Instantly access updated results, including Corbion N.V. (CRBNAS)'s intrinsic value.
- Step 5: Make well-informed investment choices or create reports based on the generated outputs.
Why Opt for This Calculator?
- Precision: Leverage real Corbion N.V. financial data for utmost accuracy.
- Versatility: Users can easily experiment with and adjust input parameters.
- Efficiency: Eliminate the complexities of constructing a DCF model from the ground up.
- Expert-Level: Crafted with the expertise and usability considerations of top financial professionals.
- Accessible: Designed for simplicity, making it suitable for all users, regardless of their financial modeling background.
Who Can Benefit from Corbion N.V. (CRBNAS)?
- Investors: Make informed choices with our advanced valuation tools tailored for the market.
- Financial Analysts: Streamline your analysis with our ready-to-use financial models that can be easily modified.
- Consultants: Effortlessly customize our templates for impactful client presentations and reports.
- Finance Enthusiasts: Enhance your understanding of valuation methodologies through practical, real-world scenarios.
- Educators and Students: Utilize this resource as a hands-on tool in finance curricula and workshops.
Contents of the Template
- Pre-Filled Data: Contains Corbion N.V.'s historical financial information and projections.
- Discounted Cash Flow Model: An editable DCF valuation model with automated calculations.
- Weighted Average Cost of Capital (WACC): A specific sheet designed for calculating WACC using tailored inputs.
- Key Financial Ratios: Assess Corbion N.V.'s profitability, operational efficiency, and financial leverage.
- Customizable Inputs: Easily modify revenue growth rates, profit margins, and tax assumptions.
- Clear Dashboard: Visual representations including charts and tables that summarize essential valuation findings.
Disclaimer
All information, articles, and product details provided on this website are for general informational and educational purposes only. We do not claim any ownership over, nor do we intend to infringe upon, any trademarks, copyrights, logos, brand names, or other intellectual property mentioned or depicted on this site. Such intellectual property remains the property of its respective owners, and any references here are made solely for identification or informational purposes, without implying any affiliation, endorsement, or partnership.
We make no representations or warranties, express or implied, regarding the accuracy, completeness, or suitability of any content or products presented. Nothing on this website should be construed as legal, tax, investment, financial, medical, or other professional advice. In addition, no part of this site—including articles or product references—constitutes a solicitation, recommendation, endorsement, advertisement, or offer to buy or sell any securities, franchises, or other financial instruments, particularly in jurisdictions where such activity would be unlawful.
All content is of a general nature and may not address the specific circumstances of any individual or entity. It is not a substitute for professional advice or services. Any actions you take based on the information provided here are strictly at your own risk. You accept full responsibility for any decisions or outcomes arising from your use of this website and agree to release us from any liability in connection with your use of, or reliance upon, the content or products found herein.