
|
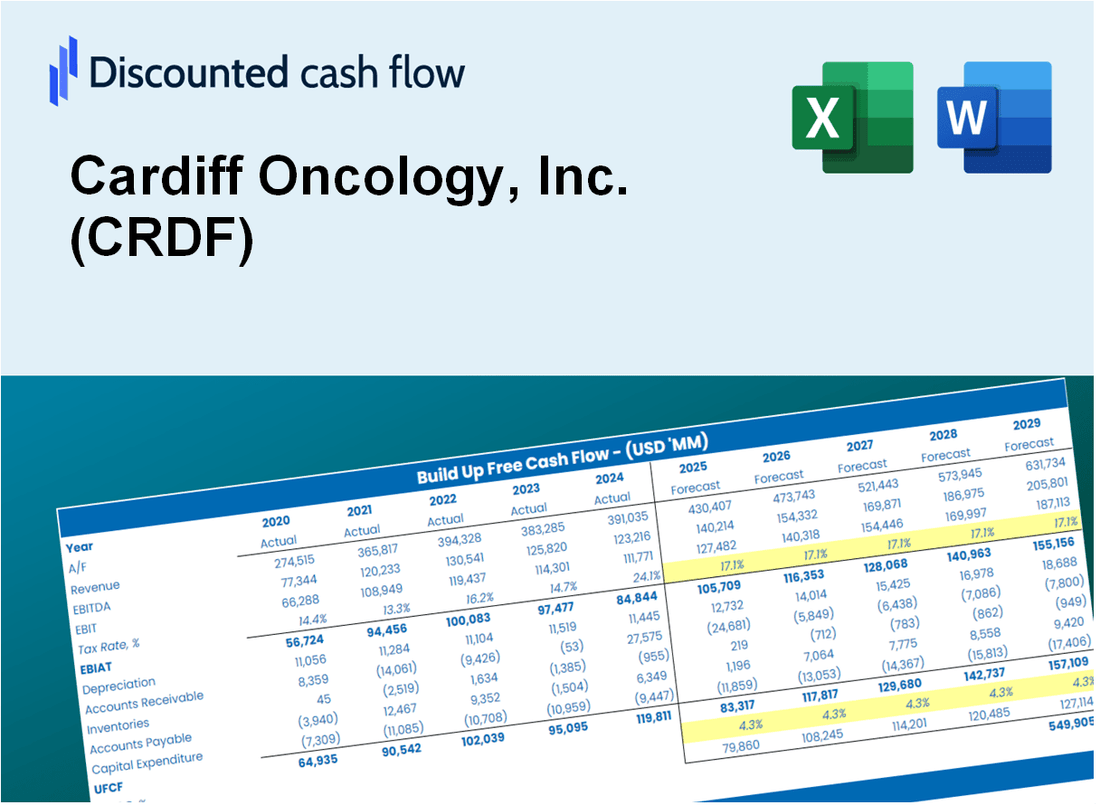
Cardiff Oncology, Inc. (CRDF) DCF -Bewertung |
Fully Editable: Tailor To Your Needs In Excel Or Sheets
Professional Design: Trusted, Industry-Standard Templates
Investor-Approved Valuation Models
MAC/PC Compatible, Fully Unlocked
No Expertise Is Needed; Easy To Follow
Cardiff Oncology, Inc. (CRDF) Bundle
Unser (CRDF) DCF-Taschenrechner entwickelt für die Genauigkeit und ermöglicht es Ihnen, Cardiff Oncology, Inc. zu bewerten, indem Sie reale Finanzdaten anhand von realen Finanzdaten bewerten, während Sie vollständige Flexibilität bieten, um alle wesentlichen Parameter für verbesserte Prognosen zu ändern.
What You Will Get
- Comprehensive CRDF Financials: Access to historical and projected data for precise valuation.
- Customizable Inputs: Adjust parameters like WACC, tax rates, revenue growth, and capital expenditures.
- Real-Time Calculations: Dynamic computation of intrinsic value and NPV.
- Scenario Simulation: Analyze various scenarios to assess Cardiff Oncology's future performance.
- User-Friendly Interface: Designed for professionals while remaining accessible to newcomers.
Key Features
- Customizable Financial Inputs: Adjust essential parameters such as revenue projections, operating margins, and research & development expenses.
- Instant DCF Valuation: Quickly computes intrinsic value, net present value (NPV), and additional financial metrics.
- High-Precision Analysis: Leverages Cardiff Oncology’s (CRDF) actual financial data for accurate valuation results.
- Effortless Scenario Testing: Easily evaluate different scenarios and analyze their impacts on financial outcomes.
- Efficiency Booster: Streamlines the valuation process, removing the need to create intricate models from the ground up.
How It Works
- Step 1: Download the prebuilt Excel template with Cardiff Oncology’s (CRDF) data included.
- Step 2: Explore the pre-filled sheets and familiarize yourself with the key metrics.
- Step 3: Update forecasts and assumptions in the editable yellow cells (WACC, growth, margins).
- Step 4: Instantly view recalculated results, including Cardiff Oncology’s (CRDF) intrinsic value.
- Step 5: Make informed investment decisions or generate reports using the outputs.
Why Choose Cardiff Oncology, Inc. (CRDF)?
- Innovative Solutions: Cutting-edge therapies designed to target cancer more effectively.
- Proven Expertise: A team of seasoned professionals dedicated to advancing cancer treatment.
- Robust Research: Backed by extensive clinical trials and scientific validation.
- Patient-Centric Approach: Focused on improving patient outcomes and quality of life.
- Commitment to Excellence: Striving for the highest standards in oncology care and research.
Who Should Use This Product?
- Investors: Accurately assess Cardiff Oncology’s (CRDF) fair value prior to making investment choices.
- CFOs: Utilize a professional-grade DCF model for financial reporting and strategic analysis related to Cardiff Oncology.
- Consultants: Easily modify the template for valuation reports tailored to clients interested in Cardiff Oncology.
- Entrepreneurs: Acquire knowledge about financial modeling practices employed by leading biotech firms.
- Educators: Employ it as a teaching resource to illustrate valuation techniques in the biotech sector.
What the Template Contains
- Preloaded CRDF Data: Historical and projected financial data, including revenue, EBIT, and capital expenditures.
- DCF and WACC Models: Professional-grade sheets for calculating intrinsic value and Weighted Average Cost of Capital.
- Editable Inputs: Yellow-highlighted cells for adjusting revenue growth, tax rates, and discount rates.
- Financial Statements: Comprehensive annual and quarterly financials for deeper analysis.
- Key Ratios: Profitability, leverage, and efficiency ratios to evaluate performance.
- Dashboard and Charts: Visual summaries of valuation outcomes and assumptions.
Disclaimer
All information, articles, and product details provided on this website are for general informational and educational purposes only. We do not claim any ownership over, nor do we intend to infringe upon, any trademarks, copyrights, logos, brand names, or other intellectual property mentioned or depicted on this site. Such intellectual property remains the property of its respective owners, and any references here are made solely for identification or informational purposes, without implying any affiliation, endorsement, or partnership.
We make no representations or warranties, express or implied, regarding the accuracy, completeness, or suitability of any content or products presented. Nothing on this website should be construed as legal, tax, investment, financial, medical, or other professional advice. In addition, no part of this site—including articles or product references—constitutes a solicitation, recommendation, endorsement, advertisement, or offer to buy or sell any securities, franchises, or other financial instruments, particularly in jurisdictions where such activity would be unlawful.
All content is of a general nature and may not address the specific circumstances of any individual or entity. It is not a substitute for professional advice or services. Any actions you take based on the information provided here are strictly at your own risk. You accept full responsibility for any decisions or outcomes arising from your use of this website and agree to release us from any liability in connection with your use of, or reliance upon, the content or products found herein.