
|
Crocs, Inc. (Crox) DCF -Bewertung |
Fully Editable: Tailor To Your Needs In Excel Or Sheets
Professional Design: Trusted, Industry-Standard Templates
Investor-Approved Valuation Models
MAC/PC Compatible, Fully Unlocked
No Expertise Is Needed; Easy To Follow
Crocs, Inc. (CROX) Bundle
Stürzen Sie Ihre Analyse und verbessern Sie die Präzision mit unserem [Crox] DCF -Taschenrechner! Mit realen Daten von Crocs, Inc. und einstellbaren Annahmen ermöglichen dieses Tool Sie, CROCs wie ein erfahrener Investor zu prognostizieren, zu analysieren und zu bewerten.
What You Will Get
- Real CROX Financials: Comprehensive historical and projected data for precise valuation.
- Customizable Inputs: Adjust WACC, tax rates, revenue growth, and capital expenditures to fit your analysis.
- Dynamic Calculations: Intrinsic value and NPV are automatically computed in real-time.
- Scenario Analysis: Explore various scenarios to assess Crocs’ future performance.
- User-Friendly Design: Crafted for professionals while remaining approachable for newcomers.
Key Features
- Comprehensive Historical Data: Crocs, Inc.'s financial statements and pre-filled growth projections.
- Customizable Parameters: Adjust WACC, tax rates, sales growth, and profit margins to fit your analysis.
- Real-Time Valuation: Instantly view Crocs, Inc.'s intrinsic value as it updates dynamically.
- Intuitive Visualizations: Interactive dashboard charts illustrate valuation outcomes and essential metrics.
- Designed for Precision: A robust tool tailored for analysts, investors, and finance professionals.
How It Works
- Step 1: Download the Excel file for Crocs, Inc. (CROX).
- Step 2: Review Crocs’ pre-filled financial data and projections.
- Step 3: Adjust key inputs such as revenue growth, WACC, and tax rates (highlighted cells).
- Step 4: Observe the DCF model update in real-time as you modify assumptions.
- Step 5: Evaluate the outputs and utilize the results for your investment strategies.
Why Choose This Calculator for Crocs, Inc. (CROX)?
- All-in-One Solution: Combines DCF, WACC, and key financial ratio analyses tailored for Crocs, Inc. (CROX).
- Flexible Inputs: Modify the yellow-highlighted fields to explore different financial scenarios.
- In-Depth Analysis: Automatically computes the intrinsic value and Net Present Value for Crocs, Inc. (CROX).
- Preloaded Information: Features historical and projected data to provide reliable starting points.
- Expert-Level Tool: Perfect for financial analysts, investors, and business consultants focusing on Crocs, Inc. (CROX).
Who Should Use This Product?
- Individual Investors: Make informed decisions about buying or selling Crocs stock (CROX).
- Financial Analysts: Streamline valuation processes with ready-to-use financial models for Crocs (CROX).
- Consultants: Deliver professional valuation insights on Crocs (CROX) to clients quickly and accurately.
- Business Owners: Understand how companies like Crocs (CROX) are valued to guide your own business strategy.
- Finance Students: Learn valuation techniques using real-world data and scenarios related to Crocs (CROX).
What the Template Contains
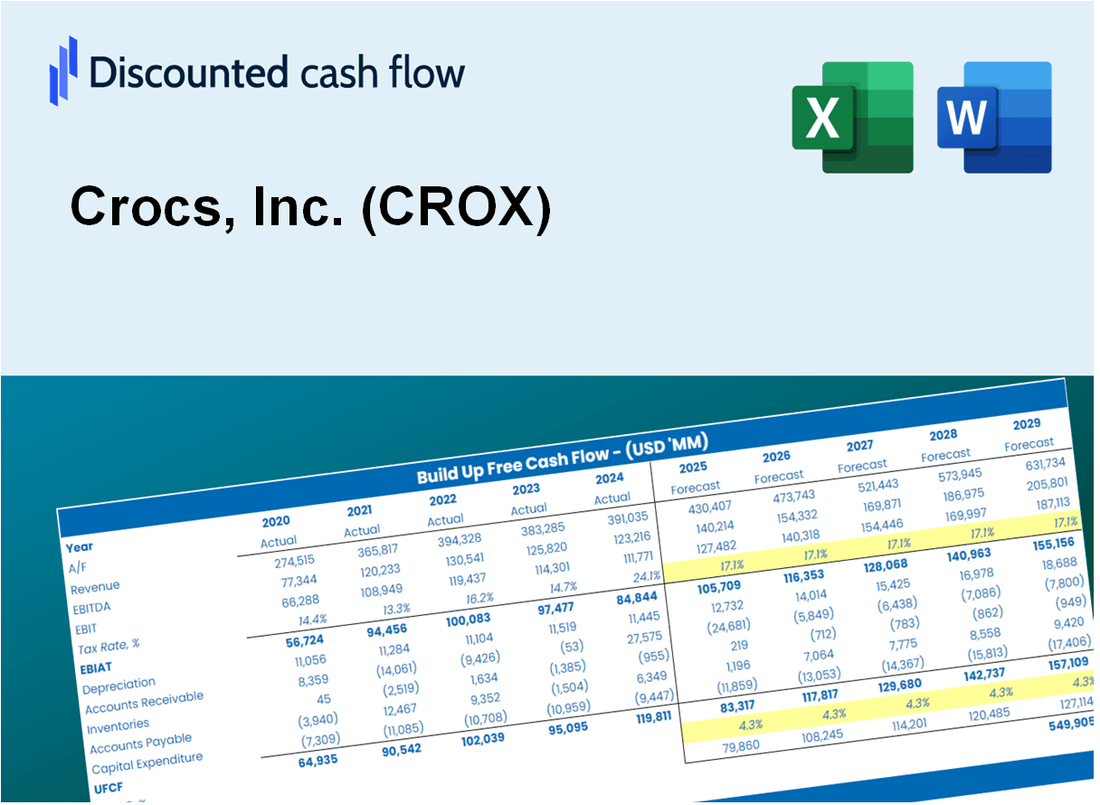
- Operating and Balance Sheet Data: Pre-filled Crocs, Inc. historical data and forecasts, including revenue, EBITDA, EBIT, and capital expenditures.
- WACC Calculation: A dedicated sheet for Weighted Average Cost of Capital (WACC), featuring parameters like Beta, risk-free rate, and share price.
- DCF Valuation (Unlevered and Levered): Editable Discounted Cash Flow models illustrating intrinsic value with comprehensive calculations.
- Financial Statements: Pre-loaded financial statements (annual and quarterly) to facilitate analysis.
- Key Ratios: Includes profitability, leverage, and efficiency ratios for Crocs, Inc. (CROX).
- Dashboard and Charts: Visual summary of valuation outputs and assumptions to simplify result analysis.
Disclaimer
All information, articles, and product details provided on this website are for general informational and educational purposes only. We do not claim any ownership over, nor do we intend to infringe upon, any trademarks, copyrights, logos, brand names, or other intellectual property mentioned or depicted on this site. Such intellectual property remains the property of its respective owners, and any references here are made solely for identification or informational purposes, without implying any affiliation, endorsement, or partnership.
We make no representations or warranties, express or implied, regarding the accuracy, completeness, or suitability of any content or products presented. Nothing on this website should be construed as legal, tax, investment, financial, medical, or other professional advice. In addition, no part of this site—including articles or product references—constitutes a solicitation, recommendation, endorsement, advertisement, or offer to buy or sell any securities, franchises, or other financial instruments, particularly in jurisdictions where such activity would be unlawful.
All content is of a general nature and may not address the specific circumstances of any individual or entity. It is not a substitute for professional advice or services. Any actions you take based on the information provided here are strictly at your own risk. You accept full responsibility for any decisions or outcomes arising from your use of this website and agree to release us from any liability in connection with your use of, or reliance upon, the content or products found herein.