
|
DCF -Bewertung der Carpenter Technology Corporation (CRS) |
Fully Editable: Tailor To Your Needs In Excel Or Sheets
Professional Design: Trusted, Industry-Standard Templates
Investor-Approved Valuation Models
MAC/PC Compatible, Fully Unlocked
No Expertise Is Needed; Easy To Follow
Carpenter Technology Corporation (CRS) Bundle
Unser DCF-Taschenrechner von Carkpenter Technology Corporation (CRS) für die Genauigkeit ermöglicht es Ihnen, die Bewertung der Carpenter Technology Corporation (CRS) mithilfe realer Finanzdaten zu bewerten, und bietet vollständige Flexibilität, um alle Schlüsselparameter für genauere Projektionen zu ändern.
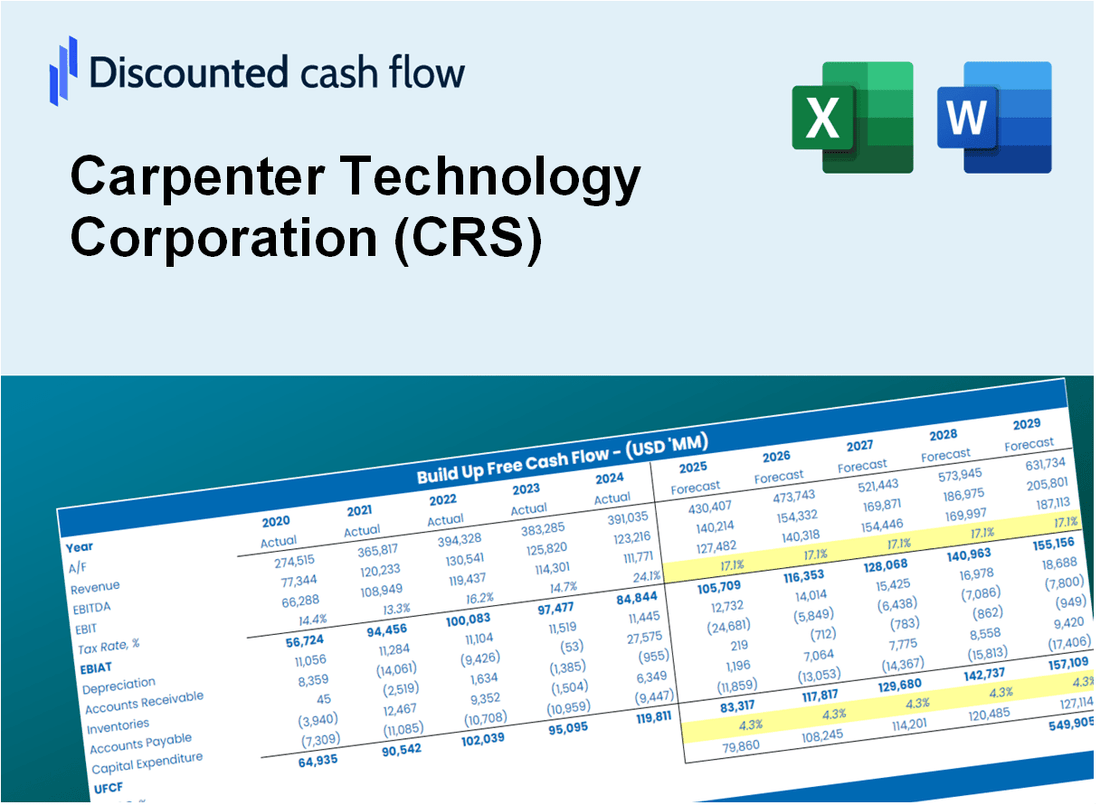
Discounted Cash Flow (DCF) - (USD MM)
| Year | AY1 2021 |
AY2 2022 |
AY3 2023 |
AY4 2024 |
AY5 2025 |
FY1 2026 |
FY2 2027 |
FY3 2028 |
FY4 2029 |
FY5 2030 |
|---|---|---|---|---|---|---|---|---|---|---|
| Revenue | 1,475.6 | 1,836.3 | 2,550.3 | 2,759.7 | 2,877.1 | 3,422.3 | 4,070.7 | 4,842.0 | 5,759.5 | 6,850.8 |
| Revenue Growth, % | 0 | 24.44 | 38.88 | 8.21 | 4.25 | 18.95 | 18.95 | 18.95 | 18.95 | 18.95 |
| EBITDA | -140.7 | 113.2 | 267.6 | 411.6 | 670.4 | 310.3 | 369.1 | 439.1 | 522.2 | 621.2 |
| EBITDA, % | -9.54 | 6.16 | 10.49 | 14.91 | 23.3 | 9.07 | 9.07 | 9.07 | 9.07 | 9.07 |
| Depreciation | 123.6 | 131.4 | 131.0 | 134.6 | 139.2 | 208.0 | 247.4 | 294.2 | 350.0 | 416.3 |
| Depreciation, % | 8.38 | 7.16 | 5.14 | 4.88 | 4.84 | 6.08 | 6.08 | 6.08 | 6.08 | 6.08 |
| EBIT | -264.3 | -18.2 | 136.6 | 277.0 | 531.2 | 102.4 | 121.7 | 144.8 | 172.3 | 204.9 |
| EBIT, % | -17.91 | -0.99112 | 5.36 | 10.04 | 18.46 | 2.99 | 2.99 | 2.99 | 2.99 | 2.99 |
| Total Cash | 287.4 | 154.2 | 44.5 | 199.1 | 315.5 | 327.2 | 389.2 | 462.9 | 550.6 | 654.9 |
| Total Cash, percent | .0 | .0 | .0 | .0 | .0 | .0 | .0 | .0 | .0 | .0 |
| Account Receivables | 308.7 | 382.3 | 531.3 | 562.6 | 575.5 | 704.7 | 838.2 | 997.1 | 1,186.0 | 1,410.7 |
| Account Receivables, % | 20.92 | 20.82 | 20.83 | 20.39 | 20 | 20.59 | 20.59 | 20.59 | 20.59 | 20.59 |
| Inventories | 425.7 | 496.1 | 639.7 | 735.4 | 793.8 | 925.3 | 1,100.6 | 1,309.2 | 1,557.2 | 1,852.3 |
| Inventories, % | 28.85 | 27.02 | 25.08 | 26.65 | 27.59 | 27.04 | 27.04 | 27.04 | 27.04 | 27.04 |
| Accounts Payable | 142.4 | 242.1 | 278.1 | 263.9 | 267.4 | 360.0 | 428.2 | 509.3 | 605.8 | 720.6 |
| Accounts Payable, % | 9.65 | 13.18 | 10.9 | 9.56 | 9.29 | 10.52 | 10.52 | 10.52 | 10.52 | 10.52 |
| Capital Expenditure | -100.5 | -91.3 | -82.3 | -96.6 | -154.3 | -163.4 | -194.4 | -231.2 | -275.0 | -327.1 |
| Capital Expenditure, % | -6.81 | -4.97 | -3.23 | -3.5 | -5.36 | -4.77 | -4.77 | -4.77 | -4.77 | -4.77 |
| Tax Rate, % | 19.54 | 19.54 | 19.54 | 19.54 | 19.54 | 19.54 | 19.54 | 19.54 | 19.54 | 19.54 |
| EBITAT | -203.7 | -14.2 | 106.3 | 244.1 | 427.4 | 82.1 | 97.7 | 116.2 | 138.2 | 164.4 |
| Depreciation | ||||||||||
| Changes in Account Receivables | ||||||||||
| Changes in Inventories | ||||||||||
| Changes in Accounts Payable | ||||||||||
| Capital Expenditure | ||||||||||
| UFCF | -772.6 | -18.4 | -101.6 | 140.9 | 344.5 | -41.4 | -89.9 | -107.0 | -127.2 | -151.3 |
| WACC, % | 9.77 | 9.78 | 9.78 | 9.81 | 9.78 | 9.78 | 9.78 | 9.78 | 9.78 | 9.78 |
| PV UFCF | ||||||||||
| SUM PV UFCF | -375.6 | |||||||||
| Long Term Growth Rate, % | 3.50 | |||||||||
| Free cash flow (T + 1) | -157 | |||||||||
| Terminal Value | -2,493 | |||||||||
| Present Terminal Value | -1,563 | |||||||||
| Enterprise Value | -1,939 | |||||||||
| Net Debt | 423 | |||||||||
| Equity Value | -2,361 | |||||||||
| Diluted Shares Outstanding, MM | 51 | |||||||||
| Equity Value Per Share | -46.58 |
What You Will Get
- Editable Excel Template: A fully customizable Excel-based DCF Calculator featuring pre-filled real CRS financials.
- Real-World Data: Historical data and forward-looking estimates (as indicated in the yellow cells).
- Forecast Flexibility: Adjust forecast assumptions such as revenue growth, EBITDA %, and WACC.
- Automatic Calculations: Instantly observe the impact of your inputs on Carpenter Technology Corporation’s valuation.
- Professional Tool: Designed for investors, CFOs, consultants, and financial analysts.
- User-Friendly Design: Organized for clarity and ease of use, accompanied by step-by-step instructions.
Key Features
- Customizable Financial Inputs: Adjust key metrics such as revenue projections, EBITDA margins, and capital investments.
- Instant DCF Valuation: Quickly computes intrinsic value, NPV, and various financial outputs.
- High-Precision Accuracy: Leverages Carpenter Technology Corporation's (CRS) actual financial data for credible valuation results.
- Simplified Scenario Analysis: Easily explore different assumptions and evaluate their impacts.
- Efficiency Booster: Avoid the hassle of creating intricate valuation models from the ground up.
How It Works
- Step 1: Download the Excel file.
- Step 2: Review Carpenter Technology Corporation’s (CRS) pre-filled financial data and forecasts.
- Step 3: Modify key inputs such as revenue growth, WACC, and tax rates (highlighted cells).
- Step 4: Observe the DCF model update in real-time as you adjust your assumptions.
- Step 5: Analyze the results and leverage the findings for your investment decisions.
Why Choose This Calculator for Carpenter Technology Corporation (CRS)?
- Accuracy: Utilizes real Carpenter Technology financial data to ensure precise calculations.
- Flexibility: Allows users to freely test and adjust inputs according to their needs.
- Time-Saving: Eliminates the need to create a discounted cash flow model from the ground up.
- Professional-Grade: Crafted with the precision and usability expected at the CFO level.
- User-Friendly: Intuitive design makes it accessible for users without extensive financial modeling skills.
Who Should Use This Product?
- Professional Investors: Develop comprehensive and accurate valuation models for analyzing Carpenter Technology Corporation (CRS) stock.
- Corporate Finance Teams: Evaluate valuation scenarios to inform strategic decisions within the company.
- Consultants and Advisors: Deliver precise valuation insights for clients interested in Carpenter Technology Corporation (CRS).
- Students and Educators: Utilize real-world data to enhance learning and practice in financial modeling.
- Manufacturing Enthusiasts: Gain insights into how manufacturing companies like Carpenter Technology Corporation (CRS) are valued in the marketplace.
What the Template Contains
- Historical Data: Includes Carpenter Technology Corporation’s (CRS) past financials and baseline forecasts.
- DCF and Levered DCF Models: Detailed templates to calculate Carpenter Technology Corporation’s (CRS) intrinsic value.
- WACC Sheet: Pre-built calculations for Weighted Average Cost of Capital.
- Editable Inputs: Modify key drivers like growth rates, EBITDA %, and CAPEX assumptions.
- Quarterly and Annual Statements: A complete breakdown of Carpenter Technology Corporation’s (CRS) financials.
- Interactive Dashboard: Visualize valuation results and projections dynamically.
Disclaimer
All information, articles, and product details provided on this website are for general informational and educational purposes only. We do not claim any ownership over, nor do we intend to infringe upon, any trademarks, copyrights, logos, brand names, or other intellectual property mentioned or depicted on this site. Such intellectual property remains the property of its respective owners, and any references here are made solely for identification or informational purposes, without implying any affiliation, endorsement, or partnership.
We make no representations or warranties, express or implied, regarding the accuracy, completeness, or suitability of any content or products presented. Nothing on this website should be construed as legal, tax, investment, financial, medical, or other professional advice. In addition, no part of this site—including articles or product references—constitutes a solicitation, recommendation, endorsement, advertisement, or offer to buy or sell any securities, franchises, or other financial instruments, particularly in jurisdictions where such activity would be unlawful.
All content is of a general nature and may not address the specific circumstances of any individual or entity. It is not a substitute for professional advice or services. Any actions you take based on the information provided here are strictly at your own risk. You accept full responsibility for any decisions or outcomes arising from your use of this website and agree to release us from any liability in connection with your use of, or reliance upon, the content or products found herein.