
|
Corsair Gaming, Inc. (CRSR) DCF -Bewertung |
Fully Editable: Tailor To Your Needs In Excel Or Sheets
Professional Design: Trusted, Industry-Standard Templates
Investor-Approved Valuation Models
MAC/PC Compatible, Fully Unlocked
No Expertise Is Needed; Easy To Follow
Corsair Gaming, Inc. (CRSR) Bundle
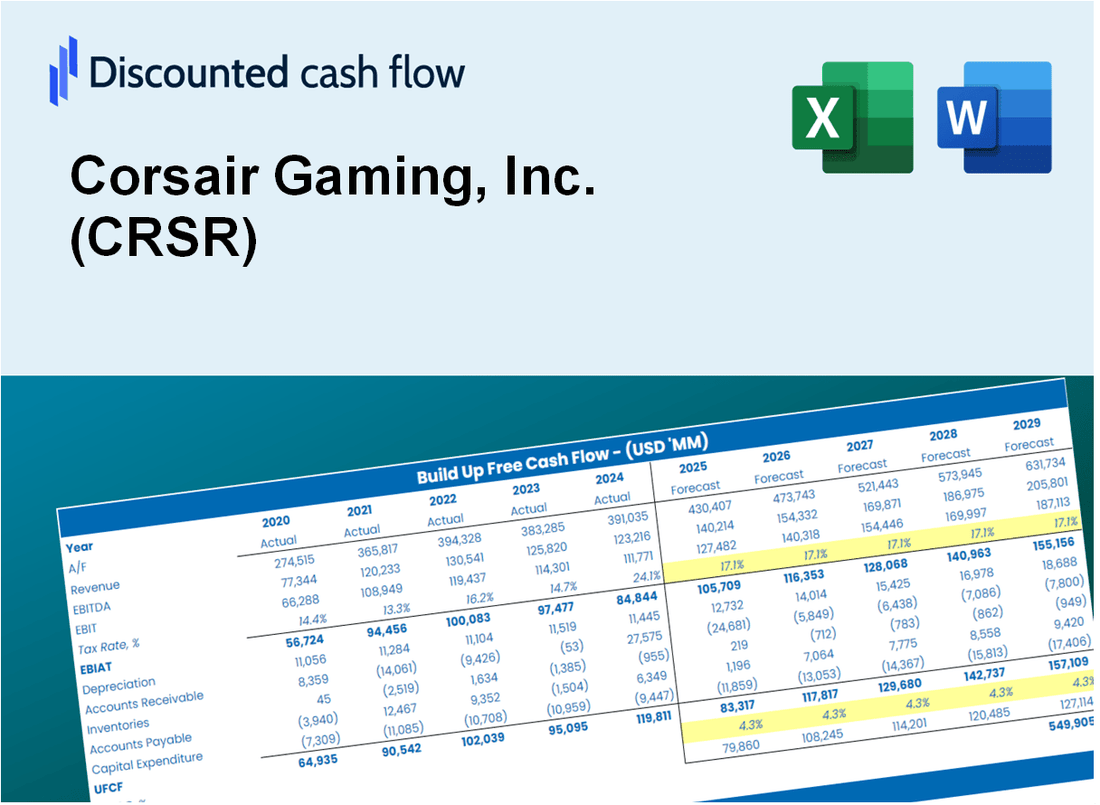
Übernehmen Sie die Bewertungsanalyse für Ihre Corsair Gaming, Inc. (CRSR) mit unserem hochmodernen DCF-Taschenrechner! Mit realen CRSR -Daten werden Sie mit dieser Excel -Vorlage Prognosen und Annahmen anpassen, um den inneren Wert von Corsair Gaming genau zu berechnen.
Discounted Cash Flow (DCF) - (USD MM)
| Year | AY1 2020 |
AY2 2021 |
AY3 2022 |
AY4 2023 |
AY5 2024 |
FY1 2025 |
FY2 2026 |
FY3 2027 |
FY4 2028 |
FY5 2029 |
|---|---|---|---|---|---|---|---|---|---|---|
| Revenue | 1,702.4 | 1,904.1 | 1,375.1 | 1,459.9 | 1,316.4 | 1,251.9 | 1,190.6 | 1,132.2 | 1,076.8 | 1,024.0 |
| Revenue Growth, % | 0 | 11.85 | -27.78 | 6.17 | -9.83 | -4.9 | -4.9 | -4.9 | -4.9 | -4.9 |
| EBITDA | 196.3 | 172.4 | -.7 | 64.6 | 3.4 | 63.2 | 60.1 | 57.1 | 54.3 | 51.7 |
| EBITDA, % | 11.53 | 9.06 | -0.04966919 | 4.43 | 0.26178 | 5.05 | 5.05 | 5.05 | 5.05 | 5.05 |
| Depreciation | 43.2 | 45.1 | 53.5 | 50.7 | 51.9 | 40.6 | 38.6 | 36.7 | 34.9 | 33.2 |
| Depreciation, % | 2.54 | 2.37 | 3.89 | 3.47 | 3.94 | 3.24 | 3.24 | 3.24 | 3.24 | 3.24 |
| EBIT | 153.1 | 127.3 | -54.2 | 13.9 | -48.5 | 22.6 | 21.5 | 20.4 | 19.4 | 18.5 |
| EBIT, % | 8.99 | 6.69 | -3.94 | 0.95494 | -3.68 | 1.8 | 1.8 | 1.8 | 1.8 | 1.8 |
| Total Cash | 129.5 | 62.4 | 151.2 | 175.6 | 107.0 | 105.3 | 100.1 | 95.2 | 90.5 | 86.1 |
| Total Cash, percent | .0 | .0 | .0 | .0 | .0 | .0 | .0 | .0 | .0 | .0 |
| Account Receivables | 293.6 | 291.3 | 235.7 | 253.3 | 218.6 | 209.4 | 199.2 | 189.4 | 180.1 | 171.3 |
| Account Receivables, % | 17.25 | 15.3 | 17.14 | 17.35 | 16.61 | 16.73 | 16.73 | 16.73 | 16.73 | 16.73 |
| Inventories | 226.0 | 298.3 | 192.7 | 240.2 | 260.0 | 198.2 | 188.5 | 179.3 | 170.5 | 162.1 |
| Inventories, % | 13.28 | 15.67 | 14.01 | 16.45 | 19.75 | 15.83 | 15.83 | 15.83 | 15.83 | 15.83 |
| Accounts Payable | 299.6 | 236.1 | 172.0 | 240.0 | 207.2 | 187.0 | 177.8 | 169.1 | 160.8 | 153.0 |
| Accounts Payable, % | 17.6 | 12.4 | 12.51 | 16.44 | 15.74 | 14.94 | 14.94 | 14.94 | 14.94 | 14.94 |
| Capital Expenditure | -9.0 | -11.0 | -26.3 | -12.8 | -9.8 | -11.6 | -11.0 | -10.5 | -10.0 | -9.5 |
| Capital Expenditure, % | -0.52803 | -0.57635 | -1.91 | -0.87412 | -0.74819 | -0.92807 | -0.92807 | -0.92807 | -0.92807 | -0.92807 |
| Tax Rate, % | -38.15 | -38.15 | -38.15 | -38.15 | -38.15 | -38.15 | -38.15 | -38.15 | -38.15 | -38.15 |
| EBITAT | 129.5 | 112.2 | -46.2 | 10.4 | -66.9 | 19.5 | 18.6 | 17.6 | 16.8 | 16.0 |
| Depreciation | ||||||||||
| Changes in Account Receivables | ||||||||||
| Changes in Inventories | ||||||||||
| Changes in Accounts Payable | ||||||||||
| Capital Expenditure | ||||||||||
| UFCF | -56.3 | 12.9 | 78.1 | 51.2 | -42.8 | 99.3 | 56.9 | 54.1 | 51.5 | 49.0 |
| WACC, % | 10.28 | 10.32 | 10.29 | 10.15 | 10.47 | 10.3 | 10.3 | 10.3 | 10.3 | 10.3 |
| PV UFCF | ||||||||||
| SUM PV UFCF | 241.9 | |||||||||
| Long Term Growth Rate, % | 4.00 | |||||||||
| Free cash flow (T + 1) | 51 | |||||||||
| Terminal Value | 808 | |||||||||
| Present Terminal Value | 495 | |||||||||
| Enterprise Value | 737 | |||||||||
| Net Debt | 130 | |||||||||
| Equity Value | 607 | |||||||||
| Diluted Shares Outstanding, MM | 104 | |||||||||
| Equity Value Per Share | 5.82 |
What You Will Get
- Editable Forecast Inputs: Easily adjust assumptions (growth %, margins, WACC) to develop various scenarios tailored to Corsair Gaming, Inc. (CRSR).
- Real-World Data: Corsair’s financial data pre-filled to accelerate your analysis process.
- Automatic DCF Outputs: The template computes Net Present Value (NPV) and intrinsic value automatically for you.
- Customizable and Professional: A sleek Excel model designed to fit your valuation requirements.
- Built for Analysts and Investors: Perfect for evaluating forecasts, validating strategies, and enhancing efficiency.
Key Features
- 🔍 Real-Life CRSR Financials: Pre-filled historical and projected data for Corsair Gaming, Inc.
- ✏️ Fully Customizable Inputs: Adjust all critical parameters (yellow cells) like WACC, growth %, and tax rates.
- 📊 Professional DCF Valuation: Built-in formulas calculate Corsair’s intrinsic value using the Discounted Cash Flow method.
- ⚡ Instant Results: Visualize Corsair’s valuation instantly after making changes.
- Scenario Analysis: Test and compare outcomes for various financial assumptions side-by-side.
How It Works
- 1. Access the Template: Download and open the Excel file featuring Corsair Gaming, Inc.'s (CRSR) preloaded data.
- 2. Modify Assumptions: Adjust key inputs such as growth rates, WACC, and capital expenditures specific to Corsair Gaming.
- 3. Analyze Results Instantly: The DCF model automatically computes intrinsic value and NPV based on your inputs.
- 4. Explore Scenarios: Evaluate various forecasts to assess different valuation outcomes for Corsair Gaming.
- 5. Present with Confidence: Deliver professional valuation insights to reinforce your investment decisions regarding Corsair Gaming, Inc. (CRSR).
Why Choose Corsair Gaming, Inc. (CRSR)?
- Enhance Your Gaming Experience: Our products are designed to provide top-notch performance for gamers.
- Innovative Technology: Cutting-edge features and designs that keep you ahead in the gaming world.
- Wide Range of Products: From peripherals to gaming systems, we have everything you need.
- Community Driven: Feedback from gamers shapes our products, ensuring they meet your needs.
- Trusted Brand: Recognized by gamers and professionals alike for quality and reliability.
Who Should Use This Product?
- Investors: Accurately assess Corsair Gaming's fair value before making investment decisions.
- CFOs: Utilize a professional-grade DCF model for financial reporting and analysis.
- Consultants: Easily customize the template for valuation reports tailored for clients.
- Entrepreneurs: Gain insights into financial modeling practices used by leading gaming companies.
- Educators: Employ it as a teaching resource to illustrate valuation methodologies.
What the Template Contains
- Pre-Filled Data: Includes Corsair Gaming's historical financials and forecasts.
- Discounted Cash Flow Model: Editable DCF valuation model with automatic calculations.
- Weighted Average Cost of Capital (WACC): A dedicated sheet for calculating WACC based on custom inputs.
- Key Financial Ratios: Analyze Corsair Gaming's profitability, efficiency, and leverage.
- Customizable Inputs: Edit revenue growth, margins, and tax rates with ease.
- Clear Dashboard: Charts and tables summarizing key valuation results.
Disclaimer
All information, articles, and product details provided on this website are for general informational and educational purposes only. We do not claim any ownership over, nor do we intend to infringe upon, any trademarks, copyrights, logos, brand names, or other intellectual property mentioned or depicted on this site. Such intellectual property remains the property of its respective owners, and any references here are made solely for identification or informational purposes, without implying any affiliation, endorsement, or partnership.
We make no representations or warranties, express or implied, regarding the accuracy, completeness, or suitability of any content or products presented. Nothing on this website should be construed as legal, tax, investment, financial, medical, or other professional advice. In addition, no part of this site—including articles or product references—constitutes a solicitation, recommendation, endorsement, advertisement, or offer to buy or sell any securities, franchises, or other financial instruments, particularly in jurisdictions where such activity would be unlawful.
All content is of a general nature and may not address the specific circumstances of any individual or entity. It is not a substitute for professional advice or services. Any actions you take based on the information provided here are strictly at your own risk. You accept full responsibility for any decisions or outcomes arising from your use of this website and agree to release us from any liability in connection with your use of, or reliance upon, the content or products found herein.