|
Curevac N. V. (CVAC) DCF -Bewertung |
Fully Editable: Tailor To Your Needs In Excel Or Sheets
Professional Design: Trusted, Industry-Standard Templates
Investor-Approved Valuation Models
MAC/PC Compatible, Fully Unlocked
No Expertise Is Needed; Easy To Follow
CureVac N.V. (CVAC) Bundle
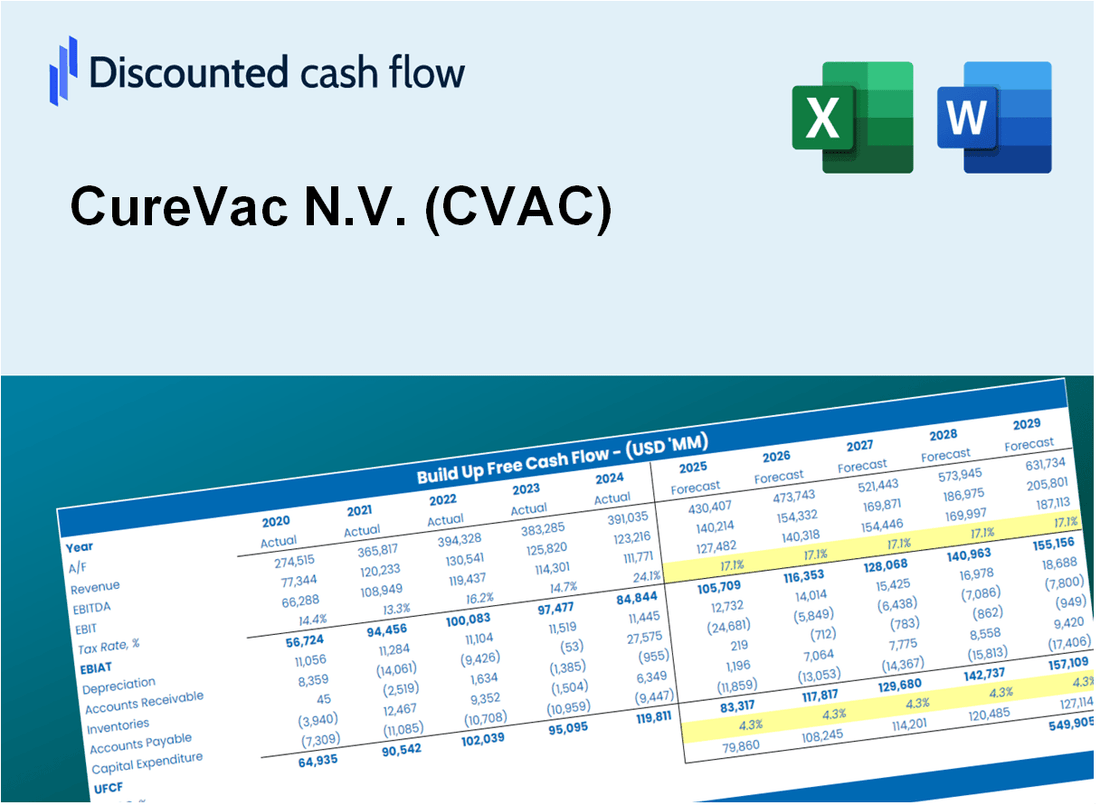
Möchten Sie den inneren Wert von Curevac N.V. bestimmen? Unser CVAC DCF-Taschenrechner integriert reale Daten mit umfassenden Anpassungsfunktionen, sodass Sie Ihre Prognosen verfeinern und fundiertere Investitionsentscheidungen treffen können.
What You Will Get
- Editable Forecast Inputs: Easily modify key assumptions (growth %, margins, WACC) to explore various scenarios.
- Real-World Data: CureVac N.V.’s (CVAC) financial data pre-loaded to facilitate your analysis.
- Automatic DCF Outputs: The template computes Net Present Value (NPV) and intrinsic value automatically.
- Customizable and Professional: A sleek Excel model tailored to meet your valuation requirements.
- Built for Analysts and Investors: Perfect for evaluating projections, validating strategies, and enhancing efficiency.
Key Features
- Comprehensive DCF Calculator: Provides detailed unlevered and levered DCF valuation models tailored for CureVac N.V. (CVAC).
- WACC Calculator: Features a pre-built Weighted Average Cost of Capital sheet with adjustable inputs specific to CVAC.
- Customizable Forecast Assumptions: Adjust growth rates, capital expenditures, and discount rates to match CureVac's strategies.
- Integrated Financial Ratios: Evaluate profitability, leverage, and efficiency ratios relevant to CureVac N.V. (CVAC).
- Interactive Dashboard and Charts: Visual representations summarize essential valuation metrics for straightforward analysis.
How It Works
- Download the Template: Gain immediate access to the Excel-based CVAC DCF Calculator.
- Input Your Assumptions: Modify the yellow-highlighted cells for growth rates, WACC, margins, and more.
- Instant Calculations: The model automatically recalculates CureVac’s intrinsic value.
- Test Scenarios: Experiment with various assumptions to assess potential valuation shifts.
- Analyze and Decide: Utilize the results to inform your investment or financial decisions.
Why Choose This Calculator for CureVac N.V. (CVAC)?
- Designed for Experts: A sophisticated tool tailored for researchers, investors, and financial analysts.
- Comprehensive Data: CureVac’s historical and projected financials are preloaded for precision.
- Flexible Scenario Analysis: Effortlessly test various forecasts and assumptions.
- Insightful Outputs: Automatically computes intrinsic value, NPV, and essential metrics.
- User-Friendly: Step-by-step guidance ensures a smooth experience.
Who Should Use CureVac N.V. (CVAC)?
- Biotechnology Students: Explore cutting-edge mRNA technology and its applications in real-world scenarios.
- Researchers: Utilize CureVac's innovative models in your studies or clinical trials.
- Investors: Evaluate your investment strategies and analyze the market performance of CureVac N.V. (CVAC).
- Healthcare Analysts: Enhance your analysis with a tailored financial model specific to biotech firms.
- Pharmaceutical Entrepreneurs: Understand how established biotech companies like CureVac N.V. (CVAC) navigate the industry.
What the Template Contains
- Historical Data: Includes CureVac N.V.'s (CVAC) past financials and baseline forecasts.
- DCF and Levered DCF Models: Detailed templates to calculate CureVac N.V.'s (CVAC) intrinsic value.
- WACC Sheet: Pre-built calculations for Weighted Average Cost of Capital.
- Editable Inputs: Modify key drivers like growth rates, EBITDA %, and CAPEX assumptions.
- Quarterly and Annual Statements: A complete breakdown of CureVac N.V.'s (CVAC) financials.
- Interactive Dashboard: Visualize valuation results and projections dynamically.
Disclaimer
All information, articles, and product details provided on this website are for general informational and educational purposes only. We do not claim any ownership over, nor do we intend to infringe upon, any trademarks, copyrights, logos, brand names, or other intellectual property mentioned or depicted on this site. Such intellectual property remains the property of its respective owners, and any references here are made solely for identification or informational purposes, without implying any affiliation, endorsement, or partnership.
We make no representations or warranties, express or implied, regarding the accuracy, completeness, or suitability of any content or products presented. Nothing on this website should be construed as legal, tax, investment, financial, medical, or other professional advice. In addition, no part of this site—including articles or product references—constitutes a solicitation, recommendation, endorsement, advertisement, or offer to buy or sell any securities, franchises, or other financial instruments, particularly in jurisdictions where such activity would be unlawful.
All content is of a general nature and may not address the specific circumstances of any individual or entity. It is not a substitute for professional advice or services. Any actions you take based on the information provided here are strictly at your own risk. You accept full responsibility for any decisions or outcomes arising from your use of this website and agree to release us from any liability in connection with your use of, or reliance upon, the content or products found herein.