|
DCF -Bewertung von Docebo Inc. (DCBO) |
Fully Editable: Tailor To Your Needs In Excel Or Sheets
Professional Design: Trusted, Industry-Standard Templates
Investor-Approved Valuation Models
MAC/PC Compatible, Fully Unlocked
No Expertise Is Needed; Easy To Follow
Docebo Inc. (DCBO) Bundle
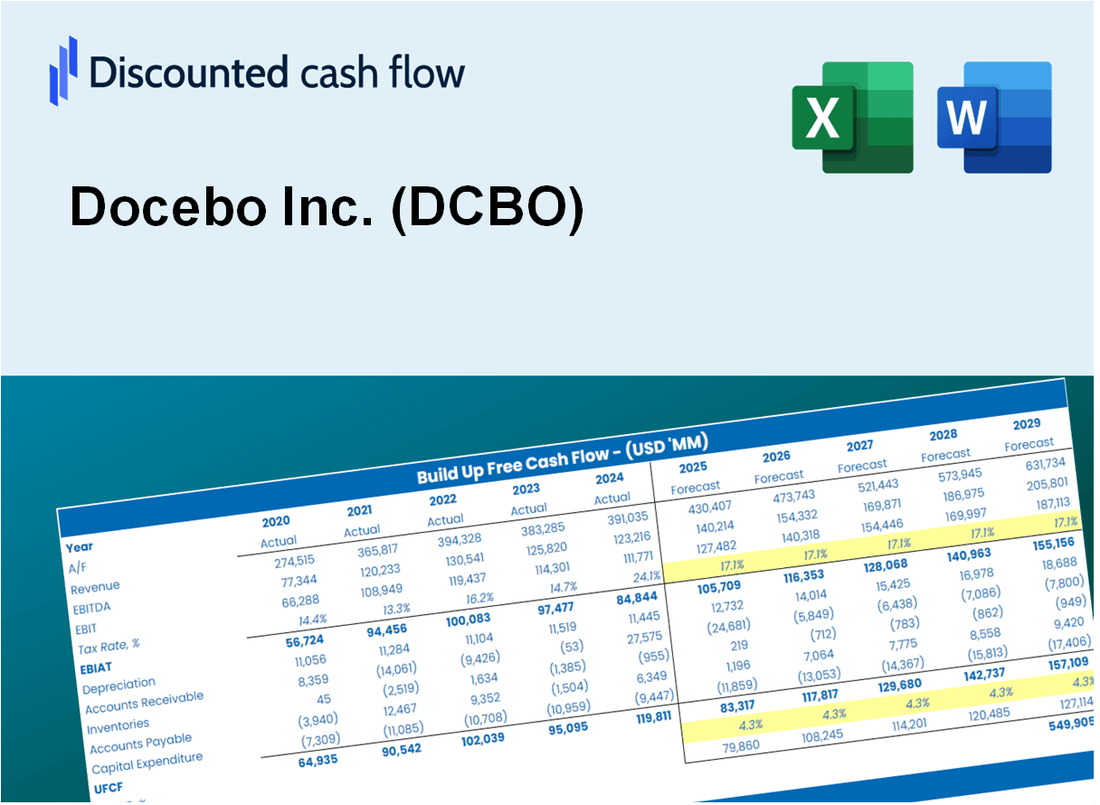
Bewerten Sie die finanzielle Aussichten von Docebo Inc. mit einer fachkundigen Präzision! Dieser DCF-Taschenrechner (DCBO) liefert vorgefüllte Finanzdaten und ermöglicht es Ihnen, das Umsatzwachstum, WACC, Margen und andere wesentliche Annahmen anzupassen, um sich mit Ihren Vorhersagen anzupassen.
What You Will Get
- Real DCBO Financials: Access to historical and projected data for precise valuation.
- Customizable Inputs: Adjust WACC, tax rates, revenue growth, and capital expenditures as needed.
- Dynamic Calculations: Intrinsic value and NPV are computed in real-time.
- Scenario Analysis: Evaluate various scenarios to assess Docebo's future performance.
- User-Friendly Design: Designed for professionals while remaining approachable for newcomers.
Key Features
- Customizable Learning Parameters: Adjust essential metrics such as course completion rates, user engagement, and content effectiveness.
- Instant Analytics Dashboard: Provides real-time insights into user performance and learning outcomes.
- Enterprise-Level Precision: Leverages Docebo's extensive data to deliver accurate training effectiveness assessments.
- Effortless Scenario Testing: Easily simulate various training strategies and evaluate their impact on learning results.
- Efficiency Booster: Streamlines the process of creating comprehensive training programs without starting from scratch.
How It Works
- Step 1: Download the Excel file.
- Step 2: Review Docebo Inc.’s pre-filled financial data and forecasts.
- Step 3: Modify critical inputs like revenue growth, WACC, and tax rates (highlighted cells).
- Step 4: Watch the DCF model update instantly as you adjust your assumptions.
- Step 5: Analyze the outputs and leverage the results for investment decisions.
Why Choose Docebo Inc. (DCBO) Calculator?
- All-in-One Solution: Features DCF, WACC, and financial ratio analyses seamlessly integrated.
- Flexible Inputs: Modify the yellow-highlighted fields to explore different scenarios.
- In-Depth Analysis: Automatically computes Docebo’s intrinsic value and Net Present Value.
- Preloaded Information: Access to historical and projected data for reliable starting points.
- High-Quality Standards: Perfect for financial analysts, investors, and business consultants.
Who Should Use This Product?
- Investors: Evaluate Docebo Inc.’s (DCBO) market performance before making investment decisions.
- CFOs and Financial Analysts: Enhance valuation methods and assess financial forecasts.
- Startup Founders: Understand the valuation strategies of leading tech companies like Docebo.
- Consultants: Create comprehensive valuation reports for your clients using Docebo's data.
- Students and Educators: Utilize real-time data to learn and teach valuation principles effectively.
What the Template Contains
- Preloaded DCBO Data: Historical and projected financial data, including revenue, EBIT, and capital expenditures.
- DCF and WACC Models: Professional-grade sheets for calculating intrinsic value and Weighted Average Cost of Capital.
- Editable Inputs: Yellow-highlighted cells for adjusting revenue growth, tax rates, and discount rates.
- Financial Statements: Comprehensive annual and quarterly financials for deeper analysis.
- Key Ratios: Profitability, leverage, and efficiency ratios to evaluate performance.
- Dashboard and Charts: Visual summaries of valuation outcomes and assumptions.
Disclaimer
All information, articles, and product details provided on this website are for general informational and educational purposes only. We do not claim any ownership over, nor do we intend to infringe upon, any trademarks, copyrights, logos, brand names, or other intellectual property mentioned or depicted on this site. Such intellectual property remains the property of its respective owners, and any references here are made solely for identification or informational purposes, without implying any affiliation, endorsement, or partnership.
We make no representations or warranties, express or implied, regarding the accuracy, completeness, or suitability of any content or products presented. Nothing on this website should be construed as legal, tax, investment, financial, medical, or other professional advice. In addition, no part of this site—including articles or product references—constitutes a solicitation, recommendation, endorsement, advertisement, or offer to buy or sell any securities, franchises, or other financial instruments, particularly in jurisdictions where such activity would be unlawful.
All content is of a general nature and may not address the specific circumstances of any individual or entity. It is not a substitute for professional advice or services. Any actions you take based on the information provided here are strictly at your own risk. You accept full responsibility for any decisions or outcomes arising from your use of this website and agree to release us from any liability in connection with your use of, or reliance upon, the content or products found herein.