
|
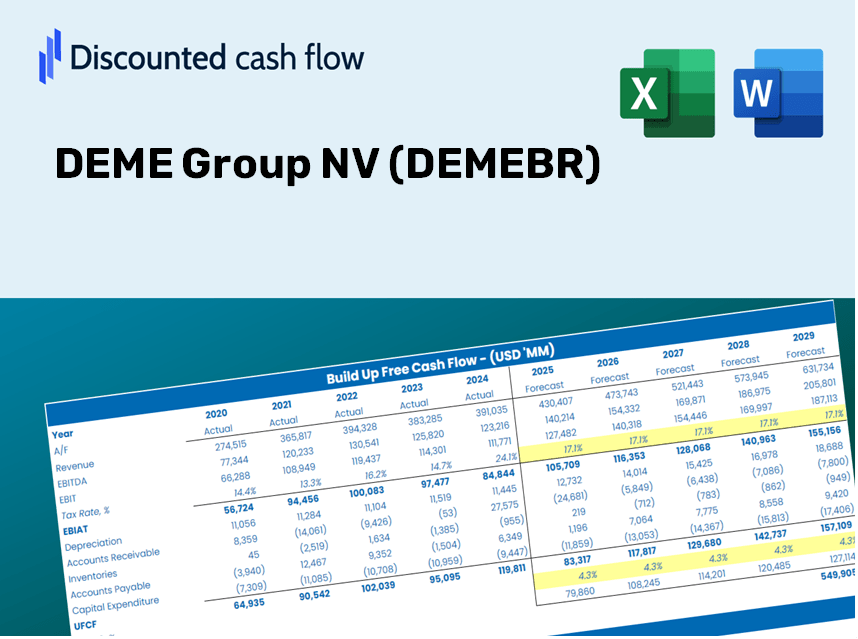
Deme Group NV (Deme.br) DCF -Bewertung |
Fully Editable: Tailor To Your Needs In Excel Or Sheets
Professional Design: Trusted, Industry-Standard Templates
Investor-Approved Valuation Models
MAC/PC Compatible, Fully Unlocked
No Expertise Is Needed; Easy To Follow
DEME Group NV (DEME.BR) Bundle
Möchten Sie die inneren Wert von DEME Group NV bewerten? Unser (Demebr) DCF-Taschenrechner integriert reale Daten mit umfangreichen Anpassungsfunktionen, sodass Sie Prognosen verfeinern und Ihre Anlagestrategien verbessern können.
What You Will Receive
- Adjustable Forecast Parameters: Effortlessly modify assumptions (growth %, margins, WACC) to explore various scenarios.
- Real-Time Data: DEME Group NV’s financial information pre-loaded to kickstart your analysis.
- Automated DCF Calculations: The template computes Net Present Value (NPV) and intrinsic value automatically.
- Tailored and Professional: A sleek Excel model that adjusts to your valuation requirements.
- Designed for Analysts and Investors: Perfect for evaluating projections, confirming strategies, and optimizing efficiency.
Key Features
- Customizable Projection Inputs: Adjust essential parameters such as revenue growth, EBITDA %, and capital investment.
- Instant DCF Valuation: Automatically computes intrinsic value, NPV, and additional metrics at the click of a button.
- High-Accuracy Professional Standards: Leverages DEME Group NV’s (DEMEBR) real financial data for accurate valuation results.
- Simplified Scenario Analysis: Effortlessly evaluate various assumptions and analyze different outcomes.
- Efficiency Booster: Save time by avoiding the complexity of building comprehensive valuation models from the ground up.
How It Works
- Step 1: Download the ready-to-use Excel template containing DEME Group NV's (DEMEBR) data.
- Step 2: Review the pre-filled worksheets to familiarize yourself with the essential metrics.
- Step 3: Modify forecasts and inputs in the editable yellow cells (WACC, growth, margins).
- Step 4: Instantly see updated results, including the intrinsic value of DEME Group NV (DEMEBR).
- Step 5: Utilize the outputs to make informed investment choices or create detailed reports.
Why Choose This Calculator for DEME Group NV (DEMEBR)?
- All-in-One Solution: Combines DCF, WACC, and financial ratio analyses for comprehensive evaluation.
- Flexible Inputs: Modify the yellow-highlighted fields to explore different scenarios.
- In-Depth Analysis: Automatically computes the intrinsic value and Net Present Value for DEME Group NV.
- Preloaded Information: Utilizes historical and projected data for reliable starting points.
- Professional Grade: Perfect for financial experts, investors, and business consultants focusing on DEME Group NV.
Who Can Benefit from This Product?
- Investors: Accurately assess DEME Group NV’s fair value prior to making investment choices.
- CFOs: Utilize a high-quality DCF model for comprehensive financial reporting and analysis.
- Consultants: Efficiently customize the template for client valuation reports.
- Entrepreneurs: Discover insights into financial modeling practices of major corporations.
- Educators: Employ it as a resource to showcase valuation techniques in the classroom.
What the Template Includes
- Pre-Filled Data: Contains DEME Group NV’s historical financial performance and projections.
- Discounted Cash Flow Model: An editable DCF valuation template with automated calculations.
- Weighted Average Cost of Capital (WACC): A specific sheet for WACC calculations based on user-defined inputs.
- Key Financial Ratios: Assess DEME Group NV’s profitability, operational efficiency, and financial leverage.
- Customizable Inputs: Easily modify revenue growth rates, profit margins, and tax implications.
- Clear Dashboard: Visuals and tables that outline essential valuation findings.
Disclaimer
All information, articles, and product details provided on this website are for general informational and educational purposes only. We do not claim any ownership over, nor do we intend to infringe upon, any trademarks, copyrights, logos, brand names, or other intellectual property mentioned or depicted on this site. Such intellectual property remains the property of its respective owners, and any references here are made solely for identification or informational purposes, without implying any affiliation, endorsement, or partnership.
We make no representations or warranties, express or implied, regarding the accuracy, completeness, or suitability of any content or products presented. Nothing on this website should be construed as legal, tax, investment, financial, medical, or other professional advice. In addition, no part of this site—including articles or product references—constitutes a solicitation, recommendation, endorsement, advertisement, or offer to buy or sell any securities, franchises, or other financial instruments, particularly in jurisdictions where such activity would be unlawful.
All content is of a general nature and may not address the specific circumstances of any individual or entity. It is not a substitute for professional advice or services. Any actions you take based on the information provided here are strictly at your own risk. You accept full responsibility for any decisions or outcomes arising from your use of this website and agree to release us from any liability in connection with your use of, or reliance upon, the content or products found herein.