
|
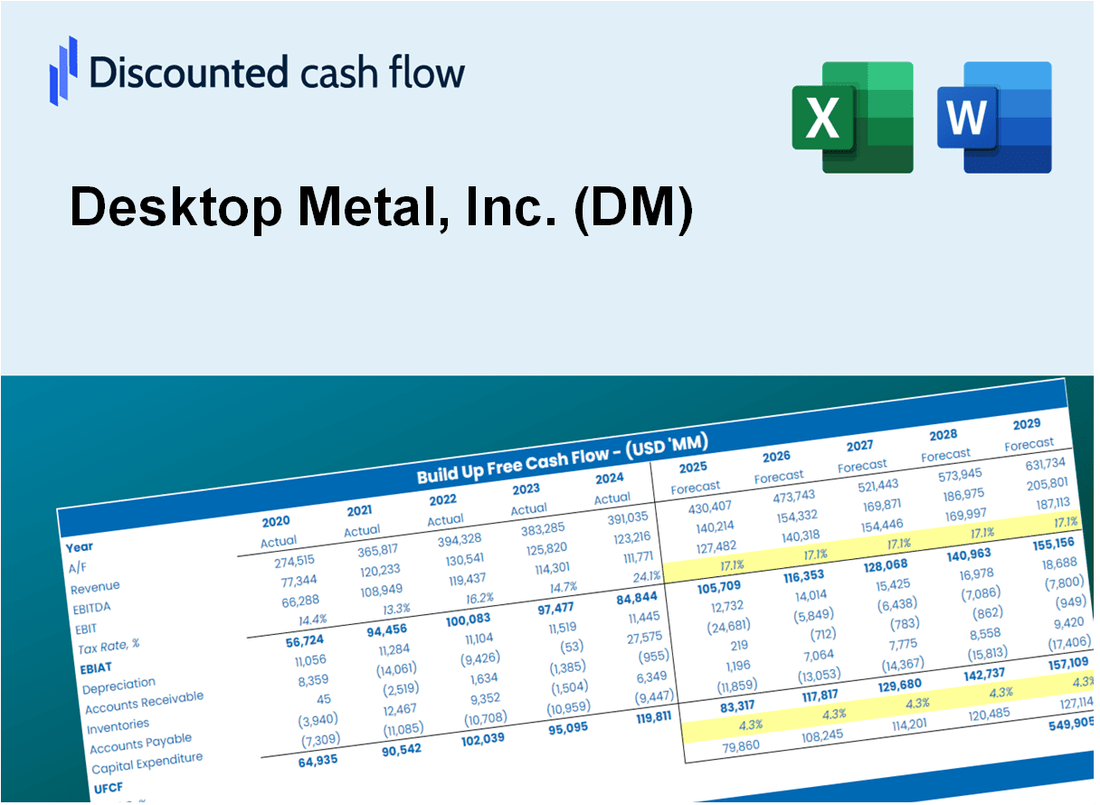
Desktop Metal, Inc. (DM) DCF -Bewertung |
Fully Editable: Tailor To Your Needs In Excel Or Sheets
Professional Design: Trusted, Industry-Standard Templates
Investor-Approved Valuation Models
MAC/PC Compatible, Fully Unlocked
No Expertise Is Needed; Easy To Follow
Desktop Metal, Inc. (DM) Bundle
Unser DCF-Taschenrechner Desktop Metal, Inc. (DM) für Genauigkeit entwickelt, ermöglicht es Sie, die Bewertung von Desktop Metal mithilfe realer Finanzdaten zu bewerten und gleichzeitig vollständige Flexibilität zu bieten, um die Schlüsselparameter für verbesserte Projektionen zu ändern.
Discounted Cash Flow (DCF) - (USD MM)
| Year | AY1 2019 |
AY2 2020 |
AY3 2021 |
AY4 2022 |
AY5 2023 |
FY1 2024 |
FY2 2025 |
FY3 2026 |
FY4 2027 |
FY5 2028 |
|---|---|---|---|---|---|---|---|---|---|---|
| Revenue | 34.6 | 16.5 | 112.4 | 209.0 | 189.7 | 248.7 | 326.0 | 427.3 | 560.1 | 734.2 |
| Revenue Growth, % | 0 | -52.37 | 582.5 | 85.95 | -9.25 | 31.08 | 31.08 | 31.08 | 31.08 | 31.08 |
| EBITDA | -95.0 | -26.1 | -243.8 | -689.3 | -268.7 | -248.7 | -326.0 | -427.3 | -560.1 | -734.2 |
| EBITDA, % | -274.69 | -158.63 | -216.92 | -329.79 | -141.63 | -100 | -100 | -100 | -100 | -100 |
| Depreciation | 8.1 | 8.5 | 26.0 | 50.8 | 53.6 | 75.0 | 98.3 | 128.8 | 168.8 | 221.3 |
| Depreciation, % | 23.42 | 51.61 | 23.14 | 24.29 | 28.26 | 30.14 | 30.14 | 30.14 | 30.14 | 30.14 |
| EBIT | -103.1 | -34.6 | -269.9 | -740.1 | -322.3 | -248.7 | -326.0 | -427.3 | -560.1 | -734.2 |
| EBIT, % | -298.11 | -210.24 | -240.07 | -354.07 | -169.89 | -100 | -100 | -100 | -100 | -100 |
| Total Cash | 14.9 | 595.4 | 269.6 | 184.5 | 84.5 | 186.9 | 245.0 | 321.1 | 420.9 | 551.8 |
| Total Cash, percent | .0 | .0 | .0 | .0 | .0 | .0 | .0 | .0 | .0 | .0 |
| Account Receivables | 4.5 | 6.5 | 46.7 | 38.5 | 37.7 | 65.9 | 86.3 | 113.2 | 148.4 | 194.5 |
| Account Receivables, % | 13.08 | 39.56 | 41.53 | 18.41 | 19.87 | 26.49 | 26.49 | 26.49 | 26.49 | 26.49 |
| Inventories | 8.9 | 9.7 | 65.4 | 91.7 | 82.6 | 114.5 | 150.1 | 196.8 | 257.9 | 338.1 |
| Inventories, % | 25.69 | 58.94 | 58.18 | 43.89 | 43.56 | 46.05 | 46.05 | 46.05 | 46.05 | 46.05 |
| Accounts Payable | 10.2 | 7.6 | 31.6 | 25.1 | 18.2 | 62.3 | 81.7 | 107.1 | 140.4 | 184.0 |
| Accounts Payable, % | 29.58 | 46.09 | 28.07 | 12.01 | 9.59 | 25.07 | 25.07 | 25.07 | 25.07 | 25.07 |
| Capital Expenditure | -.8 | -1.4 | -28.9 | -11.5 | -2.8 | -21.7 | -28.4 | -37.3 | -48.8 | -64.0 |
| Capital Expenditure, % | -2.25 | -8.68 | -25.71 | -5.51 | -1.46 | -8.72 | -8.72 | -8.72 | -8.72 | -8.72 |
| Tax Rate, % | 0.95136 | 0.95136 | 0.95136 | 0.95136 | 0.95136 | 0.95136 | 0.95136 | 0.95136 | 0.95136 | 0.95136 |
| EBITAT | -107.3 | -34.3 | -240.2 | -738.6 | -319.2 | -242.1 | -317.4 | -416.0 | -545.3 | -714.8 |
| Depreciation | ||||||||||
| Changes in Account Receivables | ||||||||||
| Changes in Inventories | ||||||||||
| Changes in Accounts Payable | ||||||||||
| Capital Expenditure | ||||||||||
| UFCF | -103.2 | -32.7 | -315.0 | -723.9 | -265.4 | -204.8 | -284.2 | -372.6 | -488.4 | -640.2 |
| WACC, % | 5.72 | 5.7 | 5.51 | 5.71 | 5.7 | 5.67 | 5.67 | 5.67 | 5.67 | 5.67 |
| PV UFCF | ||||||||||
| SUM PV UFCF | -1,641.9 | |||||||||
| Long Term Growth Rate, % | 2.00 | |||||||||
| Free cash flow (T + 1) | -653 | |||||||||
| Terminal Value | -17,811 | |||||||||
| Present Terminal Value | -13,521 | |||||||||
| Enterprise Value | -15,163 | |||||||||
| Net Debt | 60 | |||||||||
| Equity Value | -15,223 | |||||||||
| Diluted Shares Outstanding, MM | 32 | |||||||||
| Equity Value Per Share | -472.47 |
What You Will Get
- Real DM Financials: Access to historical and projected data for precise valuation.
- Customizable Inputs: Adjust WACC, tax rates, revenue growth, and capital expenditures as needed.
- Dynamic Calculations: Intrinsic value and NPV are computed in real-time.
- Scenario Analysis: Explore various scenarios to assess Desktop Metal's future performance.
- User-Friendly Design: Designed for industry professionals while remaining approachable for newcomers.
Key Features
- Accurate Financial Data: Gain access to reliable pre-loaded historical figures and future forecasts for Desktop Metal, Inc. (DM).
- Adjustable Forecast Parameters: Modify highlighted cells for key metrics such as WACC, growth rates, and profit margins.
- Real-Time Calculations: Experience automatic updates for DCF, Net Present Value (NPV), and cash flow assessments.
- Interactive Dashboard: Utilize user-friendly charts and summaries to effectively visualize your valuation outcomes.
- Designed for All Users: An intuitive layout tailored for investors, CFOs, and consultants, catering to both professionals and novices.
How It Works
- Step 1: Download the prebuilt Excel template featuring Desktop Metal, Inc.'s (DM) data.
- Step 2: Navigate through the pre-filled sheets to familiarize yourself with essential metrics.
- Step 3: Modify forecasts and assumptions in the editable yellow cells (WACC, growth, margins).
- Step 4: Instantly see updated results, including Desktop Metal, Inc.'s (DM) intrinsic value.
- Step 5: Utilize the outputs to make informed investment decisions or create reports.
Why Choose This Calculator for Desktop Metal, Inc. (DM)?
- Accuracy: Utilizes real Desktop Metal financial data to ensure precision.
- Flexibility: Allows users to freely test and adjust inputs as needed.
- Time-Saving: Eliminate the need to create a DCF model from the ground up.
- Professional-Grade: Crafted with the precision and usability expected at the CFO level.
- User-Friendly: Intuitive design makes it accessible for users without advanced financial modeling skills.
Who Should Use This Product?
- Investors: Evaluate Desktop Metal’s valuation prior to making investment decisions.
- CFOs and Financial Analysts: Optimize valuation methodologies and assess financial forecasts.
- Startup Founders: Understand the valuation processes of innovative companies like Desktop Metal.
- Consultants: Provide comprehensive valuation analyses for clients in the manufacturing sector.
- Students and Educators: Utilize current data to explore and teach valuation strategies.
What the Template Contains
- Operating and Balance Sheet Data: Pre-filled Desktop Metal, Inc. (DM) historical data and forecasts, including revenue, EBITDA, EBIT, and capital expenditures.
- WACC Calculation: A dedicated sheet for Weighted Average Cost of Capital (WACC), including parameters like Beta, risk-free rate, and share price.
- DCF Valuation (Unlevered and Levered): Editable Discounted Cash Flow models showing intrinsic value with detailed calculations.
- Financial Statements: Pre-loaded financial statements (annual and quarterly) to support analysis.
- Key Ratios: Includes profitability, leverage, and efficiency ratios for Desktop Metal, Inc. (DM).
- Dashboard and Charts: Visual summary of valuation outputs and assumptions to analyze results easily.
Disclaimer
All information, articles, and product details provided on this website are for general informational and educational purposes only. We do not claim any ownership over, nor do we intend to infringe upon, any trademarks, copyrights, logos, brand names, or other intellectual property mentioned or depicted on this site. Such intellectual property remains the property of its respective owners, and any references here are made solely for identification or informational purposes, without implying any affiliation, endorsement, or partnership.
We make no representations or warranties, express or implied, regarding the accuracy, completeness, or suitability of any content or products presented. Nothing on this website should be construed as legal, tax, investment, financial, medical, or other professional advice. In addition, no part of this site—including articles or product references—constitutes a solicitation, recommendation, endorsement, advertisement, or offer to buy or sell any securities, franchises, or other financial instruments, particularly in jurisdictions where such activity would be unlawful.
All content is of a general nature and may not address the specific circumstances of any individual or entity. It is not a substitute for professional advice or services. Any actions you take based on the information provided here are strictly at your own risk. You accept full responsibility for any decisions or outcomes arising from your use of this website and agree to release us from any liability in connection with your use of, or reliance upon, the content or products found herein.