
|
Dun & Bradstreet Holdings, Inc. (DNB) DCF -Bewertung |
Fully Editable: Tailor To Your Needs In Excel Or Sheets
Professional Design: Trusted, Industry-Standard Templates
Investor-Approved Valuation Models
MAC/PC Compatible, Fully Unlocked
No Expertise Is Needed; Easy To Follow
Dun & Bradstreet Holdings, Inc. (DNB) Bundle
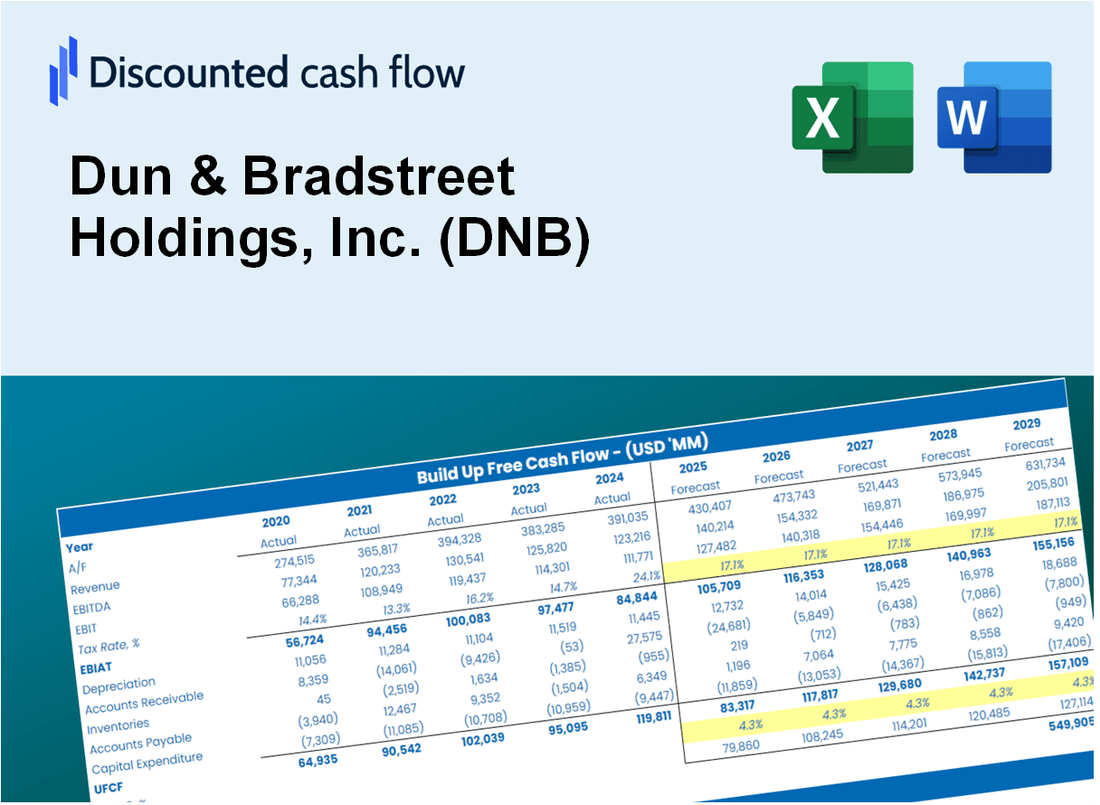
Vereinfachen Sie Dun & Bradstreet Holdings, Inc. (DNB) Bewertung mit diesem anpassbaren DCF -Taschenrechner! Mit echtem Dun & Bradstreet Holdings, Inc. (DNB) Finanzdaten und einstellbare Prognoseeingaben, Sie können Szenarien testen und Dun aufdecken & Bradstreet Holdings, Inc. (DNB) Fair -Wert in Minuten.
What You Will Get
- Editable Excel Template: A fully customizable Excel-based DCF Calculator featuring pre-filled real DNB financials.
- Real-World Data: Historical data and forward-looking estimates (as indicated in the yellow cells).
- Forecast Flexibility: Adjust forecast assumptions such as revenue growth, EBITDA %, and WACC.
- Automatic Calculations: Instantly observe the impact of your inputs on Dun & Bradstreet's valuation.
- Professional Tool: Designed for investors, CFOs, consultants, and financial analysts.
- User-Friendly Design: Organized for clarity and ease of use, complete with step-by-step instructions.
Key Features
- Comprehensive DNB Data: Pre-filled with Dun & Bradstreet’s historical financials and future-oriented projections.
- Fully Customizable Inputs: Modify revenue growth, profit margins, WACC, tax rates, and capital expenditures.
- Dynamic Valuation Model: Automatic updates to Net Present Value (NPV) and intrinsic value reflecting your inputs.
- Scenario Testing: Develop multiple forecasting scenarios to evaluate various valuation results.
- User-Friendly Design: Intuitive, organized, and crafted for both professionals and newcomers.
How It Works
- Step 1: Download the Excel file.
- Step 2: Review pre-entered Dun & Bradstreet data (historical and projected).
- Step 3: Adjust key assumptions (yellow cells) based on your analysis.
- Step 4: View automatic recalculations for Dun & Bradstreet's intrinsic value.
- Step 5: Use the outputs for investment decisions or reporting.
Why Choose This Calculator?
- Designed for Experts: A sophisticated tool tailored for analysts, CFOs, and business consultants.
- Accurate Data: Dun & Bradstreet's historical and forecasted financials preloaded for precision.
- Scenario Analysis: Effortlessly simulate various forecasts and assumptions.
- Comprehensive Outputs: Automatically computes intrinsic value, NPV, and essential metrics.
- User-Friendly: Step-by-step guidance to help you navigate the process.
Who Should Use This Product?
- Individual Investors: Gain insights to make informed decisions about investing in Dun & Bradstreet Holdings, Inc. (DNB).
- Financial Analysts: Enhance analysis efficiency with comprehensive data and analytical tools specific to DNB.
- Consultants: Provide clients with accurate and timely insights into the valuation of Dun & Bradstreet Holdings, Inc. (DNB).
- Business Owners: Learn how firms like Dun & Bradstreet are valued to inform your own business strategies.
- Finance Students: Explore valuation methodologies using real-time data and case studies related to DNB.
What the Template Contains
- Pre-Filled Data: Includes Dun & Bradstreet Holdings, Inc.'s (DNB) historical financials and forecasts.
- Discounted Cash Flow Model: Editable DCF valuation model with automatic calculations.
- Weighted Average Cost of Capital (WACC): A dedicated sheet for calculating WACC based on custom inputs.
- Key Financial Ratios: Analyze Dun & Bradstreet Holdings, Inc.'s (DNB) profitability, efficiency, and leverage.
- Customizable Inputs: Edit revenue growth, margins, and tax rates with ease.
- Clear Dashboard: Charts and tables summarizing key valuation results.
Disclaimer
All information, articles, and product details provided on this website are for general informational and educational purposes only. We do not claim any ownership over, nor do we intend to infringe upon, any trademarks, copyrights, logos, brand names, or other intellectual property mentioned or depicted on this site. Such intellectual property remains the property of its respective owners, and any references here are made solely for identification or informational purposes, without implying any affiliation, endorsement, or partnership.
We make no representations or warranties, express or implied, regarding the accuracy, completeness, or suitability of any content or products presented. Nothing on this website should be construed as legal, tax, investment, financial, medical, or other professional advice. In addition, no part of this site—including articles or product references—constitutes a solicitation, recommendation, endorsement, advertisement, or offer to buy or sell any securities, franchises, or other financial instruments, particularly in jurisdictions where such activity would be unlawful.
All content is of a general nature and may not address the specific circumstances of any individual or entity. It is not a substitute for professional advice or services. Any actions you take based on the information provided here are strictly at your own risk. You accept full responsibility for any decisions or outcomes arising from your use of this website and agree to release us from any liability in connection with your use of, or reliance upon, the content or products found herein.