
|
DAQO New Energy Corp. (DQ) DCF -Bewertung |
Fully Editable: Tailor To Your Needs In Excel Or Sheets
Professional Design: Trusted, Industry-Standard Templates
Investor-Approved Valuation Models
MAC/PC Compatible, Fully Unlocked
No Expertise Is Needed; Easy To Follow
Daqo New Energy Corp. (DQ) Bundle
Unser DCF-Taschenrechner für DAQO New Energy Corp. (DQ) ermöglicht es Ihnen, die Bewertung des Unternehmens mithilfe realer Finanzdaten zu bewerten und gleichzeitig alle wesentlichen Parameter für erweiterte Projektionen zu ändern.
What You Will Get
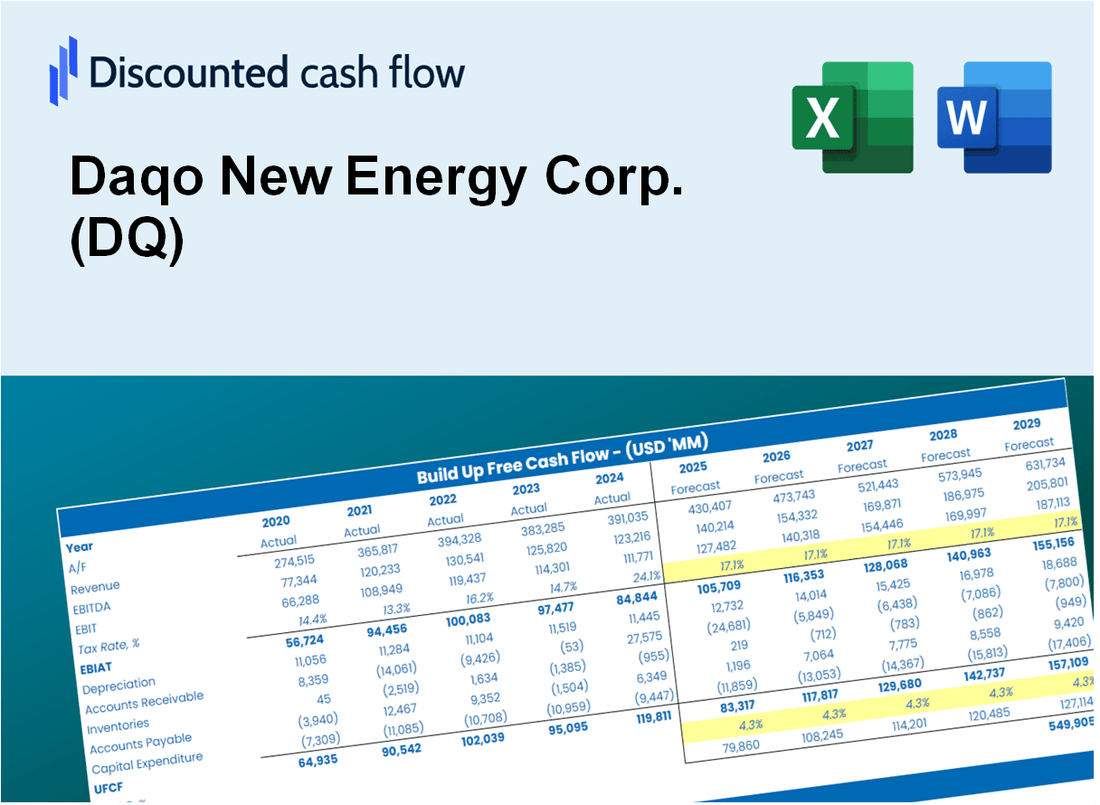
- Real Daqo Data: Preloaded financials – from revenue to EBIT – based on actual and projected figures for Daqo New Energy Corp. (DQ).
- Full Customization: Adjust all critical parameters (yellow cells) like WACC, growth %, and tax rates specific to Daqo New Energy Corp. (DQ).
- Instant Valuation Updates: Automatic recalculations to analyze the impact of changes on Daqo New Energy Corp.'s (DQ) fair value.
- Versatile Excel Template: Tailored for quick edits, scenario testing, and detailed projections for Daqo New Energy Corp. (DQ).
- Time-Saving and Accurate: Skip building models from scratch while maintaining precision and flexibility tailored for Daqo New Energy Corp. (DQ).
Key Features
- Accurate Daqo Financials: Access reliable pre-loaded historical data and future forecasts for Daqo New Energy Corp. (DQ).
- Customizable Forecast Inputs: Modify highlighted cells for parameters such as WACC, growth rates, and profit margins.
- Real-Time Calculations: Automatic updates to DCF, Net Present Value (NPV), and cash flow assessments.
- User-Friendly Dashboard: Clear charts and summaries to help visualize your valuation outcomes.
- Designed for All Levels: An intuitive layout suitable for investors, CFOs, and consultants alike.
How It Works
- Download: Obtain the pre-built Excel file containing Daqo New Energy Corp.'s (DQ) financial data.
- Customize: Modify forecasts, such as revenue growth, EBITDA %, and WACC.
- Update Automatically: The intrinsic value and NPV calculations refresh in real-time.
- Test Scenarios: Develop various projections and evaluate results instantly.
- Make Decisions: Utilize the valuation outcomes to inform your investment strategy.
Why Choose This Calculator for Daqo New Energy Corp. (DQ)?
- All-in-One Solution: Features DCF, WACC, and financial ratio analyses tailored for Daqo New Energy Corp. (DQ).
- Flexible Inputs: Modify yellow-highlighted fields to explore different financial scenarios.
- In-Depth Analysis: Automatically computes Daqo New Energy Corp.’s (DQ) intrinsic value and Net Present Value.
- Data-Rich Environment: Comes with historical and projected data for precise calculations.
- Expert-Level Tool: Perfect for financial analysts, investors, and consultants focusing on Daqo New Energy Corp. (DQ).
Who Should Use Daqo New Energy Corp. (DQ)?
- Investors: Gain insights into the renewable energy sector with a reliable investment opportunity.
- Financial Analysts: Utilize comprehensive data to enhance your market analysis and reporting.
- Consultants: Tailor your presentations with up-to-date information on Daqo New Energy Corp. (DQ) for your clients.
- Energy Sector Enthusiasts: Explore the dynamics of solar energy production and its impact on the market.
- Educators and Students: Leverage real-world case studies of Daqo New Energy Corp. (DQ) in educational settings.
What the Template Contains
- Preloaded DQ Data: Historical and projected financial data, including revenue, EBIT, and capital expenditures.
- DCF and WACC Models: Professional-grade sheets for calculating intrinsic value and Weighted Average Cost of Capital.
- Editable Inputs: Yellow-highlighted cells for adjusting revenue growth, tax rates, and discount rates.
- Financial Statements: Comprehensive annual and quarterly financials for deeper analysis.
- Key Ratios: Profitability, leverage, and efficiency ratios to evaluate performance.
- Dashboard and Charts: Visual summaries of valuation outcomes and assumptions.
Disclaimer
All information, articles, and product details provided on this website are for general informational and educational purposes only. We do not claim any ownership over, nor do we intend to infringe upon, any trademarks, copyrights, logos, brand names, or other intellectual property mentioned or depicted on this site. Such intellectual property remains the property of its respective owners, and any references here are made solely for identification or informational purposes, without implying any affiliation, endorsement, or partnership.
We make no representations or warranties, express or implied, regarding the accuracy, completeness, or suitability of any content or products presented. Nothing on this website should be construed as legal, tax, investment, financial, medical, or other professional advice. In addition, no part of this site—including articles or product references—constitutes a solicitation, recommendation, endorsement, advertisement, or offer to buy or sell any securities, franchises, or other financial instruments, particularly in jurisdictions where such activity would be unlawful.
All content is of a general nature and may not address the specific circumstances of any individual or entity. It is not a substitute for professional advice or services. Any actions you take based on the information provided here are strictly at your own risk. You accept full responsibility for any decisions or outcomes arising from your use of this website and agree to release us from any liability in connection with your use of, or reliance upon, the content or products found herein.