
|
Die DIXie Group, Inc. (DXYN) DCF -Bewertung |
Fully Editable: Tailor To Your Needs In Excel Or Sheets
Professional Design: Trusted, Industry-Standard Templates
Investor-Approved Valuation Models
MAC/PC Compatible, Fully Unlocked
No Expertise Is Needed; Easy To Follow
The Dixie Group, Inc. (DXYN) Bundle
Als Anleger oder Analyst ist dieser [Symbol] DCF -Taschenrechner ein wesentliches Werkzeug für eine genaue Bewertung. Mit echten Daten aus der Dixie Group, Inc. geladen, können Sie problemlos Prognosen anpassen und die Effekte in Echtzeit beobachten.
What You Will Get
- Editable Forecast Inputs: Easily modify assumptions (growth %, margins, WACC) to create various scenarios.
- Real-World Data: The Dixie Group, Inc.'s (DXYN) financial data pre-loaded to enhance your analysis.
- Automatic DCF Outputs: The template computes Net Present Value (NPV) and intrinsic value automatically.
- Customizable and Professional: A refined Excel model that adjusts to your valuation requirements.
- Built for Analysts and Investors: Perfect for evaluating projections, confirming strategies, and saving time.
Key Features
- 🔍 Real-Life DXYN Financials: Pre-filled historical and projected data for The Dixie Group, Inc.
- ✏️ Fully Customizable Inputs: Adjust all critical parameters (yellow cells) like WACC, growth %, and tax rates.
- 📊 Professional DCF Valuation: Built-in formulas calculate The Dixie Group’s intrinsic value using the Discounted Cash Flow method.
- ⚡ Instant Results: Visualize The Dixie Group’s valuation instantly after making changes.
- Scenario Analysis: Test and compare outcomes for various financial assumptions side-by-side.
How It Works
- Step 1: Download the Excel file for The Dixie Group, Inc. (DXYN).
- Step 2: Review the pre-filled financial data and forecasts for The Dixie Group, Inc. (DXYN).
- Step 3: Adjust key inputs such as revenue growth, WACC, and tax rates (highlighted cells) for The Dixie Group, Inc. (DXYN).
- Step 4: Observe the DCF model update in real-time as you modify your assumptions for The Dixie Group, Inc. (DXYN).
- Step 5: Evaluate the outputs and leverage the results for your investment strategies regarding The Dixie Group, Inc. (DXYN).
Why Choose The Dixie Group, Inc. (DXYN)?
- Time Efficiency: Skip the hassle of building a model from the ground up – it’s ready for immediate use.
- Enhanced Precision: Dependable financial data and formulas minimize valuation errors.
- Completely Customizable: Adjust the model to suit your specific assumptions and forecasts.
- User-Friendly: Intuitive charts and outputs simplify the analysis of results.
- Expert Endorsement: Crafted for professionals who prioritize accuracy and functionality.
Who Should Use This Product?
- Investors: Accurately assess The Dixie Group, Inc.’s (DXYN) fair value prior to making investment choices.
- CFOs: Utilize a professional-grade DCF model for financial reporting and analysis specific to The Dixie Group, Inc. (DXYN).
- Consultants: Efficiently modify the template for valuation reports tailored to clients interested in The Dixie Group, Inc. (DXYN).
- Entrepreneurs: Acquire insights into financial modeling practices employed by leading companies like The Dixie Group, Inc. (DXYN).
- Educators: Implement it as a teaching resource to illustrate valuation methodologies relevant to The Dixie Group, Inc. (DXYN).
What the Template Contains
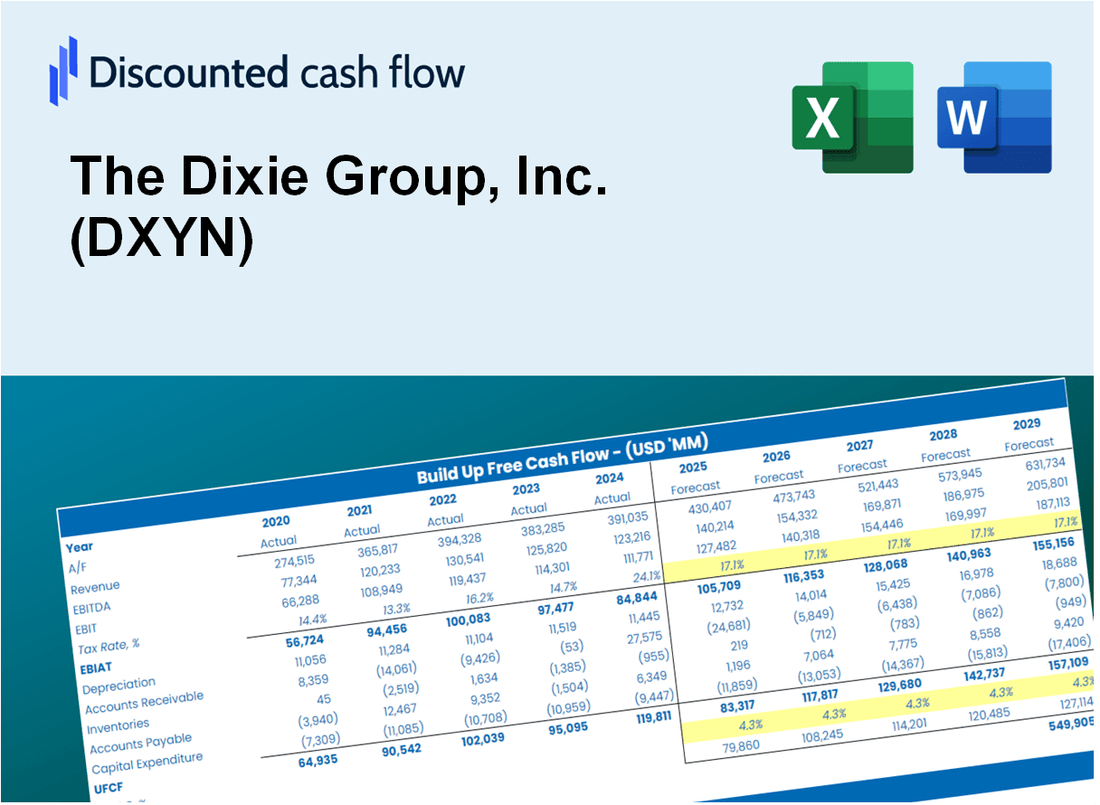
- Preloaded DXYN Data: Historical and projected financial data, including revenue, EBIT, and capital expenditures.
- DCF and WACC Models: Professional-grade sheets for calculating intrinsic value and Weighted Average Cost of Capital.
- Editable Inputs: Yellow-highlighted cells for adjusting revenue growth, tax rates, and discount rates.
- Financial Statements: Comprehensive annual and quarterly financials for deeper analysis.
- Key Ratios: Profitability, leverage, and efficiency ratios to evaluate performance.
- Dashboard and Charts: Visual summaries of valuation outcomes and assumptions.
Disclaimer
All information, articles, and product details provided on this website are for general informational and educational purposes only. We do not claim any ownership over, nor do we intend to infringe upon, any trademarks, copyrights, logos, brand names, or other intellectual property mentioned or depicted on this site. Such intellectual property remains the property of its respective owners, and any references here are made solely for identification or informational purposes, without implying any affiliation, endorsement, or partnership.
We make no representations or warranties, express or implied, regarding the accuracy, completeness, or suitability of any content or products presented. Nothing on this website should be construed as legal, tax, investment, financial, medical, or other professional advice. In addition, no part of this site—including articles or product references—constitutes a solicitation, recommendation, endorsement, advertisement, or offer to buy or sell any securities, franchises, or other financial instruments, particularly in jurisdictions where such activity would be unlawful.
All content is of a general nature and may not address the specific circumstances of any individual or entity. It is not a substitute for professional advice or services. Any actions you take based on the information provided here are strictly at your own risk. You accept full responsibility for any decisions or outcomes arising from your use of this website and agree to release us from any liability in connection with your use of, or reliance upon, the content or products found herein.