
|
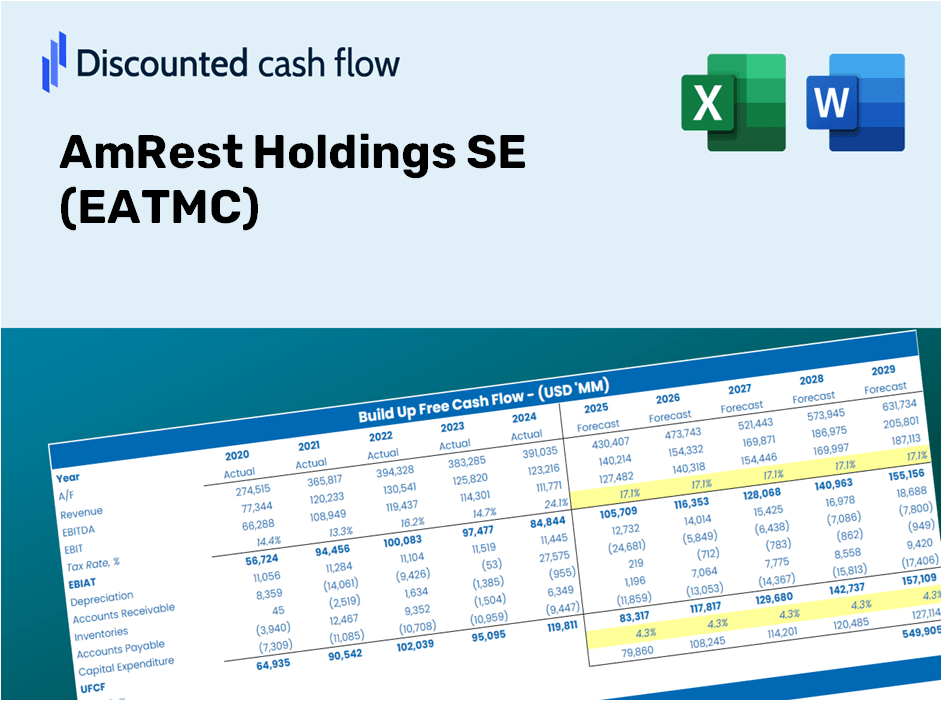
Amrest Holdings SE (EAT.MC) DCF -Bewertung |
Fully Editable: Tailor To Your Needs In Excel Or Sheets
Professional Design: Trusted, Industry-Standard Templates
Investor-Approved Valuation Models
MAC/PC Compatible, Fully Unlocked
No Expertise Is Needed; Easy To Follow
AmRest Holdings SE (EAT.MC) Bundle
Bewerten Sie die finanziellen Aussichten von Amrest Holdings SE wie ein Experte! Dieser DCF-Taschenrechner (EATMC) bietet vorgefüllte Finanzdaten und vollständige Flexibilität, um das Umsatzwachstum, die WACC, die Gewinnmargen und andere wesentliche Annahmen zu ändern, um sich an Ihren Projektionen auszurichten.
Discounted Cash Flow (DCF) - (USD MM)
| Year | AY1 2020 |
AY2 2021 |
AY3 2022 |
AY4 2023 |
AY5 2024 |
FY1 2025 |
FY2 2026 |
FY3 2027 |
FY4 2028 |
FY5 2029 |
|---|---|---|---|---|---|---|---|---|---|---|
| Revenue | 1,522.9 | 1,917.0 | 2,126.7 | 2,431.6 | 2,556.3 | 2,916.0 | 3,326.3 | 3,794.3 | 4,328.2 | 4,937.2 |
| Revenue Growth, % | 0 | 25.88 | 10.94 | 14.34 | 5.13 | 14.07 | 14.07 | 14.07 | 14.07 | 14.07 |
| EBITDA | 99.1 | 335.6 | 353.0 | 355.0 | 377.7 | 408.2 | 465.6 | 531.1 | 605.8 | 691.1 |
| EBITDA, % | 6.51 | 17.51 | 16.6 | 14.6 | 14.78 | 14 | 14 | 14 | 14 | 14 |
| Depreciation | 253.4 | 236.9 | 251.9 | 243.1 | 260.0 | 355.8 | 405.9 | 463.0 | 528.1 | 602.4 |
| Depreciation, % | 16.64 | 12.36 | 11.84 | 10 | 10.17 | 12.2 | 12.2 | 12.2 | 12.2 | 12.2 |
| EBIT | -154.3 | 98.7 | 101.1 | 111.9 | 117.7 | 52.4 | 59.7 | 68.1 | 77.7 | 88.6 |
| EBIT, % | -10.13 | 5.15 | 4.75 | 4.6 | 4.6 | 1.8 | 1.8 | 1.8 | 1.8 | 1.8 |
| Total Cash | 204.8 | 198.7 | 229.6 | 227.5 | 139.6 | 288.3 | 328.8 | 375.1 | 427.9 | 488.1 |
| Total Cash, percent | .0 | .0 | .0 | .0 | .0 | .0 | .0 | .0 | .0 | .0 |
| Account Receivables | 35.2 | 41.7 | 61.9 | 65.1 | 40.9 | 68.1 | 77.7 | 88.6 | 101.1 | 115.3 |
| Account Receivables, % | 2.31 | 2.18 | 2.91 | 2.68 | 1.6 | 2.33 | 2.33 | 2.33 | 2.33 | 2.33 |
| Inventories | 26.5 | 33.1 | 37.5 | 34.9 | 33.1 | 46.4 | 53.0 | 60.4 | 68.9 | 78.6 |
| Inventories, % | 1.74 | 1.73 | 1.76 | 1.44 | 1.29 | 1.59 | 1.59 | 1.59 | 1.59 | 1.59 |
| Accounts Payable | 235.4 | 287.2 | 340.0 | 362.9 | 308.8 | 428.2 | 488.5 | 557.2 | 635.6 | 725.1 |
| Accounts Payable, % | 15.46 | 14.98 | 15.99 | 14.92 | 12.08 | 14.69 | 14.69 | 14.69 | 14.69 | 14.69 |
| Capital Expenditure | -91.4 | -98.1 | -138.0 | -197.1 | -215.8 | -199.2 | -227.2 | -259.2 | -295.7 | -337.3 |
| Capital Expenditure, % | -6 | -5.12 | -6.49 | -8.11 | -8.44 | -6.83 | -6.83 | -6.83 | -6.83 | -6.83 |
| Tax Rate, % | 75.29 | 75.29 | 75.29 | 75.29 | 75.29 | 75.29 | 75.29 | 75.29 | 75.29 | 75.29 |
| EBITAT | -139.4 | 56.1 | 2.3 | 102.5 | 29.1 | 27.8 | 31.8 | 36.2 | 41.3 | 47.1 |
| Depreciation | ||||||||||
| Changes in Account Receivables | ||||||||||
| Changes in Inventories | ||||||||||
| Changes in Accounts Payable | ||||||||||
| Capital Expenditure | ||||||||||
| UFCF | 196.3 | 233.6 | 144.4 | 170.8 | 45.2 | 263.4 | 254.5 | 290.4 | 331.2 | 377.8 |
| WACC, % | 5.93 | 4.76 | 2.84 | 5.98 | 3.63 | 4.63 | 4.63 | 4.63 | 4.63 | 4.63 |
| PV UFCF | ||||||||||
| SUM PV UFCF | 1,315.5 | |||||||||
| Long Term Growth Rate, % | 2.00 | |||||||||
| Free cash flow (T + 1) | 385 | |||||||||
| Terminal Value | 14,670 | |||||||||
| Present Terminal Value | 11,701 | |||||||||
| Enterprise Value | 13,017 | |||||||||
| Net Debt | 1,448 | |||||||||
| Equity Value | 11,569 | |||||||||
| Diluted Shares Outstanding, MM | 217 | |||||||||
| Equity Value Per Share | 53.23 |
What You Will Receive
- Authentic AmRest Data: Preloaded financial statistics – covering everything from revenue to EBIT – based on actual and projected figures.
- Comprehensive Customization: Modify all essential parameters (yellow cells) such as WACC, growth %, and tax rates.
- Real-Time Valuation Adjustments: Automatic recalculations to assess the effects of changes on AmRest's fair value.
- Dynamic Excel Template: Designed for quick modifications, scenario analysis, and in-depth projections.
- Efficient and Precise: Eliminate the need to build models from the ground up while ensuring accuracy and adaptability.
Key Features
- Genuine AmRest Financials: Gain access to precise pre-loaded historical data and future forecasts.
- Flexible Forecast Assumptions: Modify yellow-highlighted fields such as WACC, growth rates, and profit margins.
- Real-Time Calculations: Automatic updates for DCF, Net Present Value (NPV), and cash flow evaluations.
- Interactive Dashboard: Easily interpretable charts and summaries to help visualize your valuation findings.
- Designed for Everyone: An intuitive layout created for investors, CFOs, and consultants, suitable for both novices and experts.
How It Functions
- Step 1: Download the Excel spreadsheet.
- Step 2: Examine the pre-filled AmRest Holdings SE (EATMC) data (historical and projected).
- Step 3: Modify key assumptions (highlighted in yellow) based on your evaluation.
- Step 4: Observe the automatic recalculations for AmRest Holdings SE's intrinsic value.
- Step 5: Utilize the results for investment decisions or reporting purposes.
Why Choose This Calculator for AmRest Holdings SE (EATMC)?
- User-Friendly Interface: Perfect for both novices and seasoned professionals.
- Customizable Inputs: Effortlessly adjust parameters to suit your financial analysis.
- Real-Time Valuation: Instantly observe updates to AmRest's valuation as you modify inputs.
- Pre-Loaded Data: Comes with AmRest's actual financial figures for quick and effective evaluation.
- Widely Utilized by Experts: A go-to tool for investors and analysts seeking to make well-informed choices.
Who Would Benefit from This Product?
- Finance Students: Explore valuation methodologies and implement them with real market data.
- Academics: Integrate industry-standard models into your curriculum or research initiatives.
- Investors: Validate your hypotheses and assess valuation results for AmRest Holdings SE (EATMC).
- Analysts: Optimize your analysis process with a customizable, pre-designed DCF model.
- Small Business Owners: Understand how major public companies like AmRest Holdings SE (EATMC) are evaluated.
Contents of the Template
- Historical Data: Features AmRest Holdings SE’s past financial information and baseline forecasts.
- DCF and Levered DCF Models: Comprehensive templates for calculating the intrinsic value of AmRest Holdings SE.
- WACC Sheet: Pre-configured calculations for the Weighted Average Cost of Capital.
- Editable Inputs: Adjust key parameters such as growth rates, EBITDA percentages, and CAPEX assumptions.
- Quarterly and Annual Statements: A detailed analysis of AmRest Holdings SE’s financials.
- Interactive Dashboard: Dynamically visualize valuation results and projections.
Disclaimer
All information, articles, and product details provided on this website are for general informational and educational purposes only. We do not claim any ownership over, nor do we intend to infringe upon, any trademarks, copyrights, logos, brand names, or other intellectual property mentioned or depicted on this site. Such intellectual property remains the property of its respective owners, and any references here are made solely for identification or informational purposes, without implying any affiliation, endorsement, or partnership.
We make no representations or warranties, express or implied, regarding the accuracy, completeness, or suitability of any content or products presented. Nothing on this website should be construed as legal, tax, investment, financial, medical, or other professional advice. In addition, no part of this site—including articles or product references—constitutes a solicitation, recommendation, endorsement, advertisement, or offer to buy or sell any securities, franchises, or other financial instruments, particularly in jurisdictions where such activity would be unlawful.
All content is of a general nature and may not address the specific circumstances of any individual or entity. It is not a substitute for professional advice or services. Any actions you take based on the information provided here are strictly at your own risk. You accept full responsibility for any decisions or outcomes arising from your use of this website and agree to release us from any liability in connection with your use of, or reliance upon, the content or products found herein.