
|
EPAM Systems, Inc. (EPAM) DCF -Bewertung |
Fully Editable: Tailor To Your Needs In Excel Or Sheets
Professional Design: Trusted, Industry-Standard Templates
Investor-Approved Valuation Models
MAC/PC Compatible, Fully Unlocked
No Expertise Is Needed; Easy To Follow
EPAM Systems, Inc. (EPAM) Bundle
Vereinfachen Sie die Bewertung von EPAM Systems, Inc. (EPAM) mit diesem anpassbaren DCF -Taschenrechner! Mit Real EPAM Systems, Inc. (EPAM) -Befinanzierungen und einstellbaren Prognoseeingaben können Sie Szenarien testen und EPAM Systems, Inc. (EPAM) in Minuten aufdecken.
What You Will Get
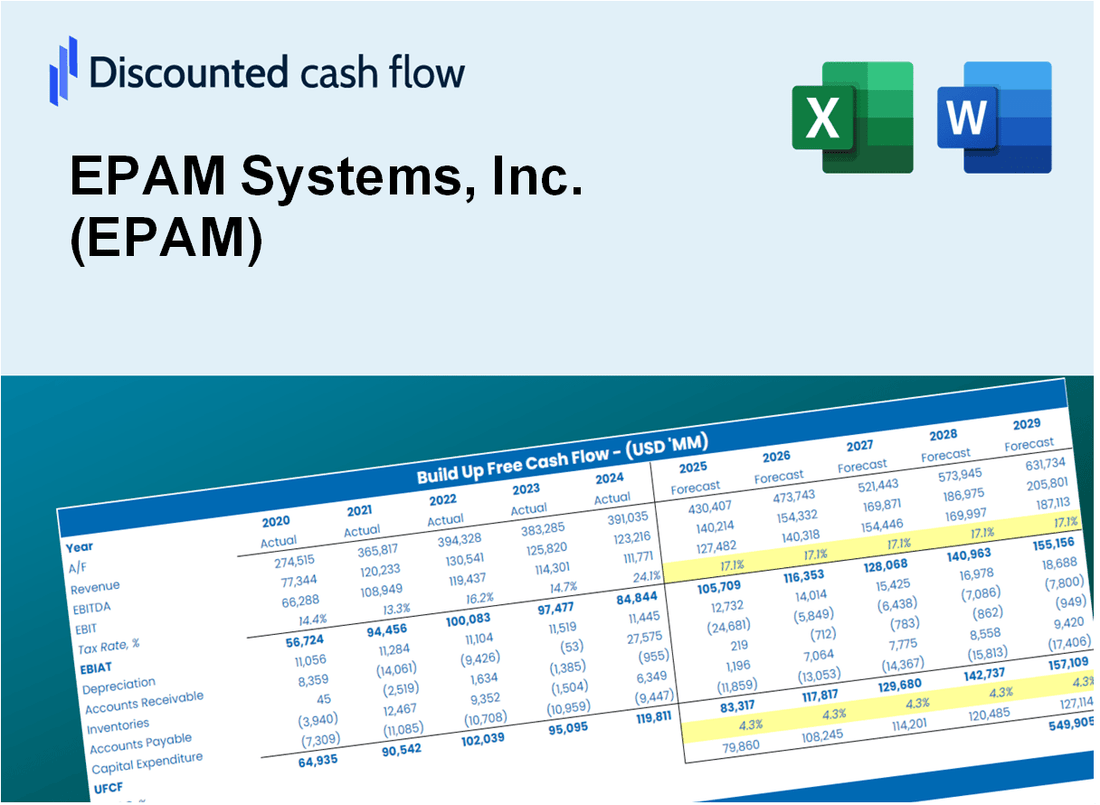
- Comprehensive EPAM Financials: Access historical and projected data for precise valuation.
- Customizable Inputs: Adjust WACC, tax rates, revenue growth, and capital expenditures as needed.
- Real-Time Calculations: Intrinsic value and NPV are computed automatically.
- Scenario Analysis: Explore various scenarios to assess EPAM's future performance.
- User-Friendly Design: Tailored for professionals while remaining approachable for newcomers.
Key Features
- Customizable Financial Inputs: Adjust essential parameters such as revenue growth, profit margins, and investment expenditures.
- Instant DCF Valuation: Quickly determines intrinsic value, NPV, and additional financial metrics.
- High-Precision Accuracy: Leverages EPAM's actual financial data for precise valuation results.
- Simplified Scenario Analysis: Effortlessly evaluate various assumptions and analyze results side by side.
- Efficiency Booster: Remove the hassle of constructing intricate valuation models from the ground up.
How It Works
- Step 1: Download the Excel file.
- Step 2: Review pre-entered EPAM data (historical and projected).
- Step 3: Adjust key assumptions (yellow cells) based on your analysis.
- Step 4: View automatic recalculations for EPAM’s intrinsic value.
- Step 5: Use the outputs for investment decisions or reporting.
Why Choose EPAM Systems, Inc. (EPAM) Calculator?
- All-in-One Solution: Incorporates DCF, WACC, and financial ratio assessments seamlessly.
- Flexible Parameters: Modify the yellow-highlighted fields to explore different financial scenarios.
- In-Depth Analysis: Automatically computes EPAM's intrinsic value and Net Present Value.
- Preloaded Information: Historical and projected data provide reliable starting points for analysis.
- High-Quality Standards: Perfect for financial analysts, investors, and business advisors.
Who Should Use This Product?
- Individual Investors: Make informed decisions about buying or selling EPAM Systems, Inc. (EPAM) stock.
- Financial Analysts: Streamline valuation processes with ready-to-use financial models for EPAM Systems, Inc. (EPAM).
- Consultants: Deliver professional valuation insights on EPAM Systems, Inc. (EPAM) to clients quickly and accurately.
- Business Owners: Understand how large companies like EPAM Systems, Inc. (EPAM) are valued to guide your own strategy.
- Finance Students: Learn valuation techniques using real-world data and scenarios related to EPAM Systems, Inc. (EPAM).
What the Template Contains
- Pre-Filled DCF Model: EPAM's financial data preloaded for immediate use.
- WACC Calculator: Detailed calculations for Weighted Average Cost of Capital.
- Financial Ratios: Evaluate EPAM's profitability, leverage, and efficiency.
- Editable Inputs: Change assumptions such as growth, margins, and CAPEX to fit your scenarios.
- Financial Statements: Annual and quarterly reports to support detailed analysis.
- Interactive Dashboard: Easily visualize key valuation metrics and results.
Disclaimer
All information, articles, and product details provided on this website are for general informational and educational purposes only. We do not claim any ownership over, nor do we intend to infringe upon, any trademarks, copyrights, logos, brand names, or other intellectual property mentioned or depicted on this site. Such intellectual property remains the property of its respective owners, and any references here are made solely for identification or informational purposes, without implying any affiliation, endorsement, or partnership.
We make no representations or warranties, express or implied, regarding the accuracy, completeness, or suitability of any content or products presented. Nothing on this website should be construed as legal, tax, investment, financial, medical, or other professional advice. In addition, no part of this site—including articles or product references—constitutes a solicitation, recommendation, endorsement, advertisement, or offer to buy or sell any securities, franchises, or other financial instruments, particularly in jurisdictions where such activity would be unlawful.
All content is of a general nature and may not address the specific circumstances of any individual or entity. It is not a substitute for professional advice or services. Any actions you take based on the information provided here are strictly at your own risk. You accept full responsibility for any decisions or outcomes arising from your use of this website and agree to release us from any liability in connection with your use of, or reliance upon, the content or products found herein.