
|
Exelixis, Inc. (Exel) DCF -Bewertung |
Fully Editable: Tailor To Your Needs In Excel Or Sheets
Professional Design: Trusted, Industry-Standard Templates
Investor-Approved Valuation Models
MAC/PC Compatible, Fully Unlocked
No Expertise Is Needed; Easy To Follow
Exelixis, Inc. (EXEL) Bundle
Vereinfachen Sie die Bewertung von Exelixis, Inc. (Exel) mit diesem anpassbaren DCF -Taschenrechner! Mit Real Exelixis, Inc. (EXEL) -Fonds und einstellbaren Prognoseeingaben können Sie Szenarien testen und Exelixis, Inc. (EXEL) in Minuten aufdecken.
What You Will Get
- Editable Forecast Inputs: Easily modify assumptions (growth %, margins, WACC) to explore various scenarios.
- Real-World Data: Exelixis, Inc. (EXEL) financial data pre-loaded to enhance your analysis.
- Automatic DCF Outputs: The template computes Net Present Value (NPV) and intrinsic value automatically.
- Customizable and Professional: A refined Excel model tailored to meet your valuation requirements.
- Built for Analysts and Investors: Perfect for evaluating projections, confirming strategies, and increasing efficiency.
Key Features
- Comprehensive DCF Calculator: Features detailed unlevered and levered DCF valuation models tailored for Exelixis, Inc. (EXEL).
- WACC Calculator: Pre-configured Weighted Average Cost of Capital sheet with adjustable inputs specific to Exelixis, Inc. (EXEL).
- Customizable Forecast Assumptions: Adjust growth rates, capital expenditures, and discount rates to reflect Exelixis, Inc. (EXEL) projections.
- Integrated Financial Ratios: Evaluate profitability, leverage, and efficiency ratios relevant to Exelixis, Inc. (EXEL).
- Interactive Dashboard and Charts: Visual representations summarize essential valuation metrics for streamlined analysis of Exelixis, Inc. (EXEL).
How It Works
- Step 1: Download the Excel file.
- Step 2: Review Exelixis, Inc.'s (EXEL) pre-filled financial data and forecasts.
- Step 3: Modify critical inputs such as revenue growth, WACC, and tax rates (highlighted cells).
- Step 4: Watch the DCF model update instantly as you tweak assumptions.
- Step 5: Analyze the outputs and use the results for investment decisions.
Why Choose This Calculator for Exelixis, Inc. (EXEL)?
- Accuracy: Utilizes real Exelixis financials to ensure precise data.
- Flexibility: Tailored for users to easily adjust and test various inputs.
- Time-Saving: Avoid the complexities of constructing a DCF model from the ground up.
- Professional-Grade: Crafted with the precision and usability expected at the CFO level.
- User-Friendly: Intuitive interface, suitable for users without extensive financial modeling skills.
Who Should Use This Product?
- Individual Investors: Make informed decisions about buying or selling Exelixis, Inc. (EXEL) stock.
- Financial Analysts: Streamline valuation processes with ready-to-use financial models for Exelixis, Inc. (EXEL).
- Consultants: Deliver professional valuation insights on Exelixis, Inc. (EXEL) to clients quickly and accurately.
- Business Owners: Understand how biotech companies like Exelixis, Inc. (EXEL) are valued to guide your own strategy.
- Finance Students: Learn valuation techniques using real-world data and scenarios related to Exelixis, Inc. (EXEL).
What the Template Contains
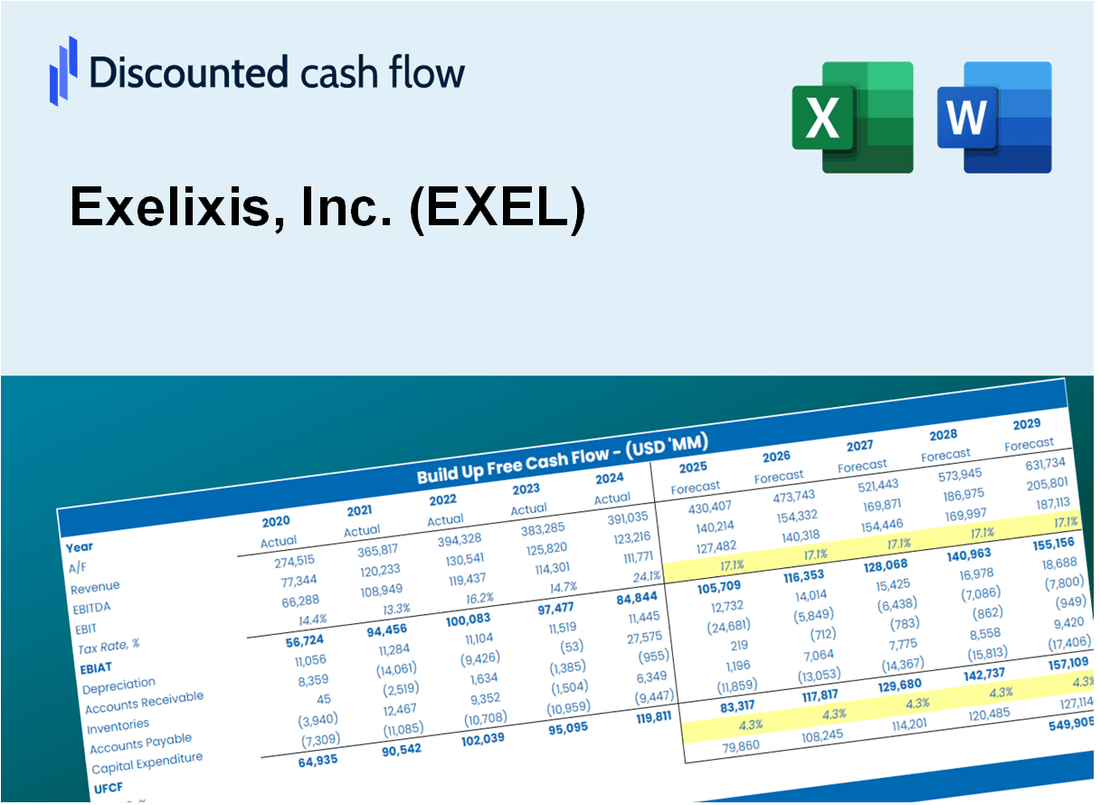
- Operating and Balance Sheet Data: Pre-filled Exelixis, Inc. (EXEL) historical data and forecasts, including revenue, EBITDA, EBIT, and capital expenditures.
- WACC Calculation: A dedicated sheet for Weighted Average Cost of Capital (WACC), including parameters like Beta, risk-free rate, and share price.
- DCF Valuation (Unlevered and Levered): Editable Discounted Cash Flow models showing intrinsic value with detailed calculations.
- Financial Statements: Pre-loaded financial statements (annual and quarterly) to support analysis.
- Key Ratios: Includes profitability, leverage, and efficiency ratios for Exelixis, Inc. (EXEL).
- Dashboard and Charts: Visual summary of valuation outputs and assumptions to analyze results easily.
Disclaimer
All information, articles, and product details provided on this website are for general informational and educational purposes only. We do not claim any ownership over, nor do we intend to infringe upon, any trademarks, copyrights, logos, brand names, or other intellectual property mentioned or depicted on this site. Such intellectual property remains the property of its respective owners, and any references here are made solely for identification or informational purposes, without implying any affiliation, endorsement, or partnership.
We make no representations or warranties, express or implied, regarding the accuracy, completeness, or suitability of any content or products presented. Nothing on this website should be construed as legal, tax, investment, financial, medical, or other professional advice. In addition, no part of this site—including articles or product references—constitutes a solicitation, recommendation, endorsement, advertisement, or offer to buy or sell any securities, franchises, or other financial instruments, particularly in jurisdictions where such activity would be unlawful.
All content is of a general nature and may not address the specific circumstances of any individual or entity. It is not a substitute for professional advice or services. Any actions you take based on the information provided here are strictly at your own risk. You accept full responsibility for any decisions or outcomes arising from your use of this website and agree to release us from any liability in connection with your use of, or reliance upon, the content or products found herein.