
|
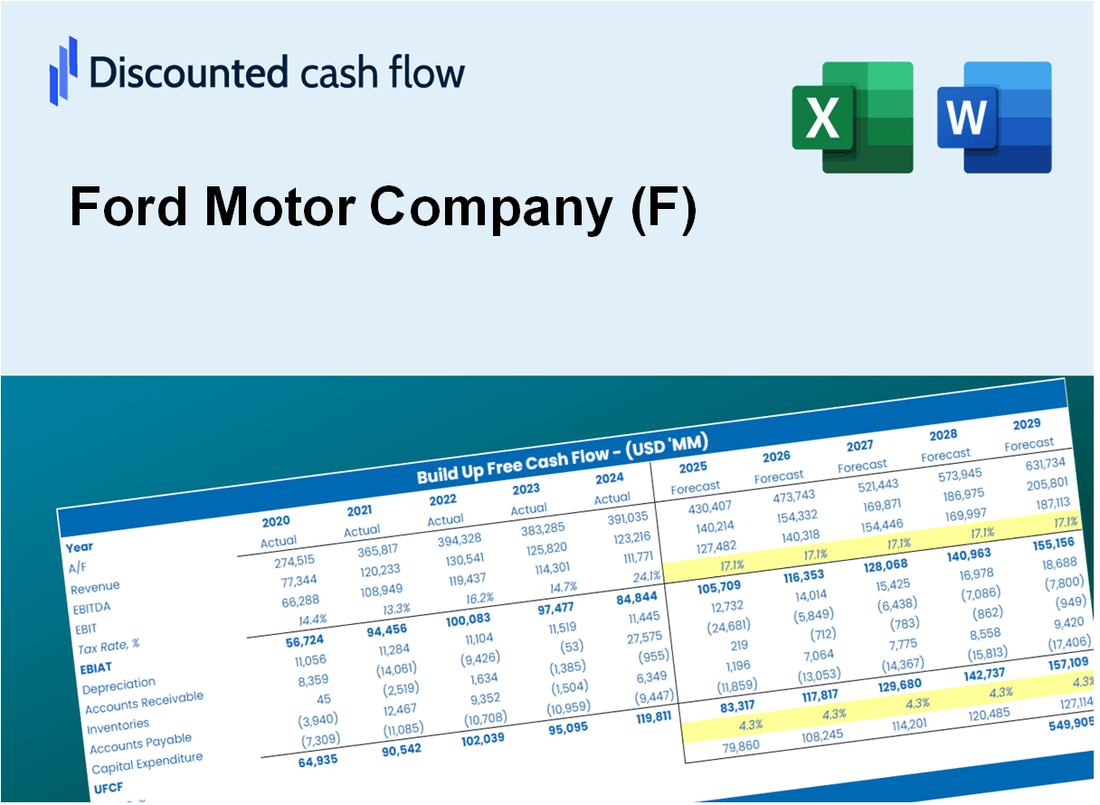
Ford Motor Company (f) DCF -Bewertung |
Fully Editable: Tailor To Your Needs In Excel Or Sheets
Professional Design: Trusted, Industry-Standard Templates
Investor-Approved Valuation Models
MAC/PC Compatible, Fully Unlocked
No Expertise Is Needed; Easy To Follow
Ford Motor Company (F) Bundle
Egal, ob Sie ein Investor oder Analyst sind, dieser Ford Motor Company (F) DCF-Taschenrechner ist Ihr Go-to-Tool für eine genaue Bewertung. Mit realen Daten von Ford vorinstalliert, können Sie Prognosen anpassen und die Effekte in Echtzeit beobachten.
What You Will Get
- Editable Excel Template: A fully customizable Excel-based DCF Calculator featuring pre-filled real Ford Motor Company (F) financials.
- Real-World Data: Historical data and forward-looking estimates (as indicated in the yellow cells).
- Forecast Flexibility: Adjust forecast assumptions such as revenue growth, EBITDA %, and WACC.
- Automatic Calculations: Quickly observe how your inputs affect Ford’s valuation.
- Professional Tool: Designed for investors, CFOs, consultants, and financial analysts.
- User-Friendly Design: Organized for clarity and ease of use, complete with step-by-step instructions.
Key Features
- Comprehensive Ford Financials: Gain access to precise pre-loaded historical data and future forecasts.
- Tailorable Forecast Assumptions: Modify yellow-highlighted cells for WACC, growth rates, and profit margins.
- Real-Time Calculations: Automatic adjustments to DCF, Net Present Value (NPV), and cash flow evaluations.
- Interactive Dashboard: User-friendly charts and summaries to illustrate your valuation outcomes.
- Suitable for All Levels: An easy-to-navigate structure designed for investors, CFOs, and consultants alike.
How It Works
- Step 1: Download the Excel file.
- Step 2: Review Ford Motor Company's pre-filled financial data and forecasts.
- Step 3: Modify key inputs such as revenue growth, WACC, and tax rates (highlighted cells).
- Step 4: Observe the DCF model update in real-time as you adjust your assumptions.
- Step 5: Evaluate the outputs and leverage the results for your investment strategies.
Why Choose This Calculator?
- User-Friendly Interface: Tailored for both novices and seasoned professionals.
- Customizable Variables: Adjust inputs effortlessly to suit your financial analysis.
- Real-Time Feedback: Observe immediate changes in Ford’s valuation as you tweak the parameters.
- Pre-Configured Data: Comes with Ford’s actual financial metrics for swift evaluations.
- Relied Upon by Experts: Utilized by investors and analysts to guide their decision-making.
Who Should Use This Product?
- Professional Investors: Develop comprehensive and accurate valuation models for portfolio assessment of Ford Motor Company (F).
- Corporate Finance Teams: Evaluate valuation scenarios to inform internal strategies for Ford Motor Company (F).
- Consultants and Advisors: Deliver precise valuation insights to clients regarding Ford Motor Company (F).
- Students and Educators: Utilize real-world data to practice and teach financial modeling with a focus on Ford Motor Company (F).
- Automotive Enthusiasts: Gain insights into how automotive companies like Ford Motor Company (F) are valued in the marketplace.
What the Template Contains
- Historical Data: Includes Ford Motor Company’s past financials and baseline forecasts.
- DCF and Levered DCF Models: Detailed templates to calculate Ford’s intrinsic value.
- WACC Sheet: Pre-built calculations for Weighted Average Cost of Capital.
- Editable Inputs: Modify key drivers like growth rates, EBITDA %, and CAPEX assumptions.
- Quarterly and Annual Statements: A complete breakdown of Ford’s financials.
- Interactive Dashboard: Visualize valuation results and projections dynamically.
Disclaimer
All information, articles, and product details provided on this website are for general informational and educational purposes only. We do not claim any ownership over, nor do we intend to infringe upon, any trademarks, copyrights, logos, brand names, or other intellectual property mentioned or depicted on this site. Such intellectual property remains the property of its respective owners, and any references here are made solely for identification or informational purposes, without implying any affiliation, endorsement, or partnership.
We make no representations or warranties, express or implied, regarding the accuracy, completeness, or suitability of any content or products presented. Nothing on this website should be construed as legal, tax, investment, financial, medical, or other professional advice. In addition, no part of this site—including articles or product references—constitutes a solicitation, recommendation, endorsement, advertisement, or offer to buy or sell any securities, franchises, or other financial instruments, particularly in jurisdictions where such activity would be unlawful.
All content is of a general nature and may not address the specific circumstances of any individual or entity. It is not a substitute for professional advice or services. Any actions you take based on the information provided here are strictly at your own risk. You accept full responsibility for any decisions or outcomes arising from your use of this website and agree to release us from any liability in connection with your use of, or reliance upon, the content or products found herein.