
|
Fluent, Inc. (FLNT) DCF -Bewertung |
Fully Editable: Tailor To Your Needs In Excel Or Sheets
Professional Design: Trusted, Industry-Standard Templates
Investor-Approved Valuation Models
MAC/PC Compatible, Fully Unlocked
No Expertise Is Needed; Easy To Follow
Fluent, Inc. (FLNT) Bundle
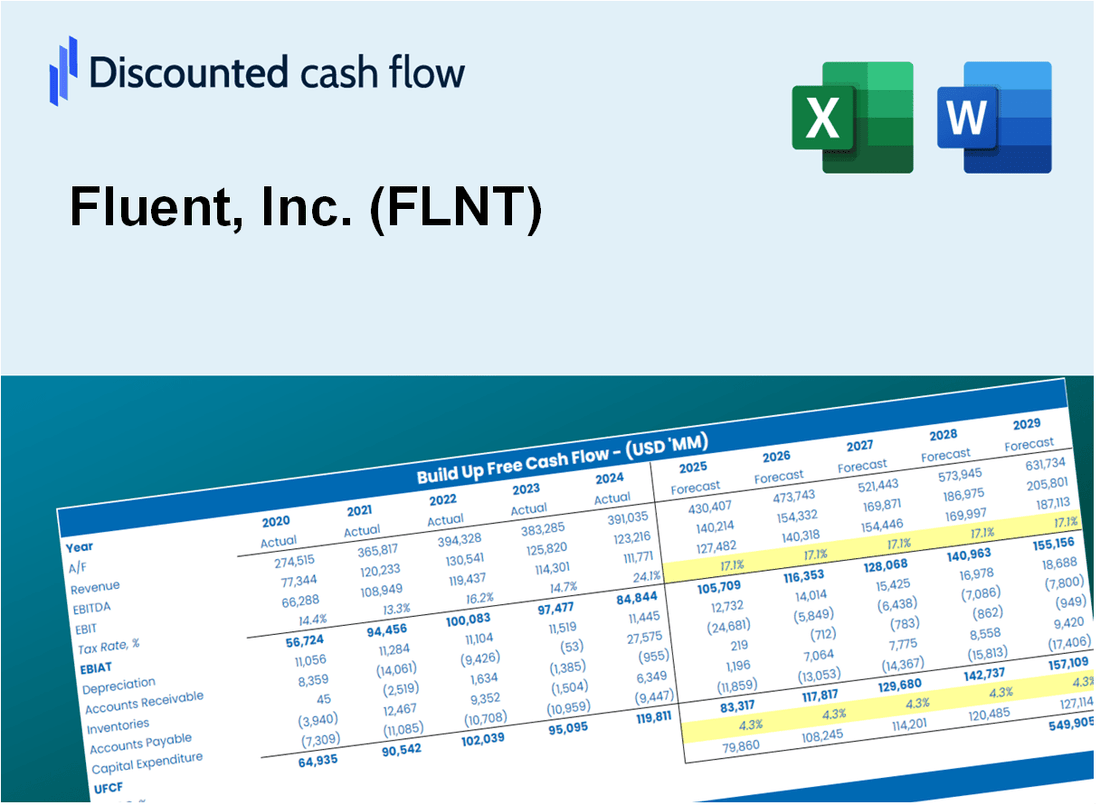
Unabhängig davon, ob Sie ein Investor oder Analyst sind, ist dieser (FLNT) DCF-Taschenrechner Ihre Anlaufstelle für eine genaue Bewertung. Mit realen Daten von Fluent, Inc., können Sie Prognosen anpassen und die Effekte in Echtzeit beobachten.
Discounted Cash Flow (DCF) - (USD MM)
| Year | AY1 2020 |
AY2 2021 |
AY3 2022 |
AY4 2023 |
AY5 2024 |
FY1 2025 |
FY2 2026 |
FY3 2027 |
FY4 2028 |
FY5 2029 |
|---|---|---|---|---|---|---|---|---|---|---|
| Revenue | 310.7 | 329.3 | 361.1 | 298.4 | 254.6 | 244.2 | 234.2 | 224.6 | 215.4 | 206.5 |
| Revenue Growth, % | 0 | 5.96 | 9.68 | -17.37 | -14.67 | -4.1 | -4.1 | -4.1 | -4.1 | -4.1 |
| EBITDA | 23.7 | 5.5 | -106.4 | -49.3 | -16.4 | -21.1 | -20.2 | -19.4 | -18.6 | -17.8 |
| EBITDA, % | 7.62 | 1.68 | -29.46 | -16.51 | -6.45 | -8.62 | -8.62 | -8.62 | -8.62 | -8.62 |
| Depreciation | 15.3 | 13.2 | 13.2 | 10.9 | 9.9 | 9.8 | 9.4 | 9.0 | 8.7 | 8.3 |
| Depreciation, % | 4.92 | 4 | 3.66 | 3.64 | 3.9 | 4.03 | 4.03 | 4.03 | 4.03 | 4.03 |
| EBIT | 8.4 | -7.6 | -119.6 | -60.1 | -26.3 | -30.9 | -29.6 | -28.4 | -27.2 | -26.1 |
| EBIT, % | 2.7 | -2.32 | -33.12 | -20.15 | -10.34 | -12.65 | -12.65 | -12.65 | -12.65 | -12.65 |
| Total Cash | 21.1 | 34.5 | 25.5 | 15.8 | 9.4 | 16.3 | 15.6 | 15.0 | 14.4 | 13.8 |
| Total Cash, percent | .0 | .0 | .0 | .0 | .0 | .0 | .0 | .0 | .0 | .0 |
| Account Receivables | 62.7 | 70.2 | 63.2 | 56.5 | 46.5 | 47.0 | 45.1 | 43.2 | 41.4 | 39.7 |
| Account Receivables, % | 20.17 | 21.33 | 17.49 | 18.94 | 18.27 | 19.24 | 19.24 | 19.24 | 19.24 | 19.24 |
| Inventories | .0 | .0 | .0 | .0 | .0 | .0 | .0 | .0 | .0 | .0 |
| Inventories, % | 0 | 0 | 0 | 0 | 0 | 0 | 0 | 0 | 0 | 0 |
| Accounts Payable | 7.7 | 16.1 | 6.2 | 11.0 | 8.8 | 7.9 | 7.6 | 7.3 | 7.0 | 6.7 |
| Accounts Payable, % | 2.48 | 4.9 | 1.71 | 3.67 | 3.45 | 3.24 | 3.24 | 3.24 | 3.24 | 3.24 |
| Capital Expenditure | -2.8 | -3.0 | -4.4 | -5.9 | -6.2 | -3.6 | -3.5 | -3.3 | -3.2 | -3.1 |
| Capital Expenditure, % | -0.91626 | -0.90904 | -1.22 | -1.96 | -2.44 | -1.49 | -1.49 | -1.49 | -1.49 | -1.49 |
| Tax Rate, % | 5.83 | 5.83 | 5.83 | 5.83 | 5.83 | 5.83 | 5.83 | 5.83 | 5.83 | 5.83 |
| EBITAT | 6.1 | -7.8 | -121.3 | -60.0 | -24.8 | -28.8 | -27.7 | -26.5 | -25.4 | -24.4 |
| Depreciation | ||||||||||
| Changes in Account Receivables | ||||||||||
| Changes in Inventories | ||||||||||
| Changes in Accounts Payable | ||||||||||
| Capital Expenditure | ||||||||||
| UFCF | -36.4 | 3.2 | -115.4 | -43.6 | -13.3 | -24.0 | -20.1 | -19.3 | -18.5 | -17.7 |
| WACC, % | 9.06 | 10.93 | 10.93 | 10.92 | 10.53 | 10.47 | 10.47 | 10.47 | 10.47 | 10.47 |
| PV UFCF | ||||||||||
| SUM PV UFCF | -75.7 | |||||||||
| Long Term Growth Rate, % | 2.00 | |||||||||
| Free cash flow (T + 1) | -18 | |||||||||
| Terminal Value | -213 | |||||||||
| Present Terminal Value | -130 | |||||||||
| Enterprise Value | -205 | |||||||||
| Net Debt | 28 | |||||||||
| Equity Value | -233 | |||||||||
| Diluted Shares Outstanding, MM | 16 | |||||||||
| Equity Value Per Share | -14.35 |
What You Will Receive
- Customizable Excel Template: A fully adaptable Excel-based DCF Calculator featuring pre-loaded real FLNT financials.
- Accurate Market Data: Historical figures and forward-looking projections (as indicated in the highlighted cells).
- Flexible Forecasting: Adjust forecast parameters such as revenue growth, EBITDA %, and WACC.
- Instant Calculations: Quickly observe how your inputs affect Fluent, Inc.'s valuation.
- Professional Resource: Designed for investors, CFOs, consultants, and financial analysts.
- Intuitive Layout: Organized for clarity and simplicity, complete with step-by-step guidance.
Key Features
- Real-Time FLNT Data: Pre-loaded with Fluent, Inc.'s historical performance metrics and future projections.
- Customizable Financial Inputs: Modify growth rates, profit margins, discount rates, tax assumptions, and capital investments.
- Interactive Valuation Framework: Instant recalculations of Net Present Value (NPV) and intrinsic value based on your parameters.
- Scenario Analysis: Develop various forecasting scenarios to evaluate different valuation possibilities.
- Intuitive User Interface: Clean, organized, and crafted for both seasoned professionals and newcomers.
How It Works
- Download: Get the pre-built Excel file featuring Fluent, Inc.'s (FLNT) financial data.
- Customize: Modify projections, including revenue growth, EBITDA %, and WACC.
- Update Automatically: Watch as the intrinsic value and NPV calculations refresh in real-time.
- Test Scenarios: Generate various forecasts and compare results instantly.
- Make Decisions: Leverage the valuation outcomes to inform your investment strategy.
Why Choose Fluent, Inc. (FLNT)?
- All-in-One Solution: Offers a complete suite of tools for market analysis, including growth metrics and performance indicators.
- Flexible Parameters: Modify highlighted fields to explore different market scenarios.
- In-Depth Analysis: Automatically computes Fluent’s market valuation and projected earnings.
- Rich Data Repository: Access to both historical and projected data for reliable insights.
- Expert-Grade Resource: Perfect for market analysts, investors, and strategic consultants.
Who Should Use Fluent, Inc. (FLNT)?
- Professional Investors: Create comprehensive and accurate valuation models for investment analysis.
- Corporate Finance Teams: Evaluate valuation scenarios to inform strategic decision-making.
- Consultants and Advisors: Offer clients precise valuation insights for Fluent, Inc. (FLNT) stock.
- Students and Educators: Utilize real-time data to learn and teach financial modeling techniques.
- Tech Enthusiasts: Explore how companies like Fluent, Inc. (FLNT) are assessed in the financial market.
What the Template Contains
- Pre-Filled Data: Contains Fluent, Inc.'s (FLNT) historical financials and projections.
- Discounted Cash Flow Model: An editable DCF valuation model featuring automatic calculations.
- Weighted Average Cost of Capital (WACC): A dedicated sheet for WACC calculations based on user-defined inputs.
- Key Financial Ratios: Evaluate Fluent, Inc.'s (FLNT) profitability, efficiency, and leverage.
- Customizable Inputs: Easily modify revenue growth, margins, and tax rates.
- Clear Dashboard: Visuals and tables summarizing critical valuation outcomes.
Disclaimer
All information, articles, and product details provided on this website are for general informational and educational purposes only. We do not claim any ownership over, nor do we intend to infringe upon, any trademarks, copyrights, logos, brand names, or other intellectual property mentioned or depicted on this site. Such intellectual property remains the property of its respective owners, and any references here are made solely for identification or informational purposes, without implying any affiliation, endorsement, or partnership.
We make no representations or warranties, express or implied, regarding the accuracy, completeness, or suitability of any content or products presented. Nothing on this website should be construed as legal, tax, investment, financial, medical, or other professional advice. In addition, no part of this site—including articles or product references—constitutes a solicitation, recommendation, endorsement, advertisement, or offer to buy or sell any securities, franchises, or other financial instruments, particularly in jurisdictions where such activity would be unlawful.
All content is of a general nature and may not address the specific circumstances of any individual or entity. It is not a substitute for professional advice or services. Any actions you take based on the information provided here are strictly at your own risk. You accept full responsibility for any decisions or outcomes arising from your use of this website and agree to release us from any liability in connection with your use of, or reliance upon, the content or products found herein.