
|
Flywire Corporation (Flyw) DCF -Bewertung |
Fully Editable: Tailor To Your Needs In Excel Or Sheets
Professional Design: Trusted, Industry-Standard Templates
Investor-Approved Valuation Models
MAC/PC Compatible, Fully Unlocked
No Expertise Is Needed; Easy To Follow
Flywire Corporation (FLYW) Bundle
Möchten Sie den inneren Wert der Flywire Corporation bewerten? Unser FlyW DCF-Taschenrechner integriert reale Daten mit umfassenden Anpassungsfunktionen, sodass Sie Ihre Projektionen verfeinern und Ihre Anlagestrategien verbessern können.
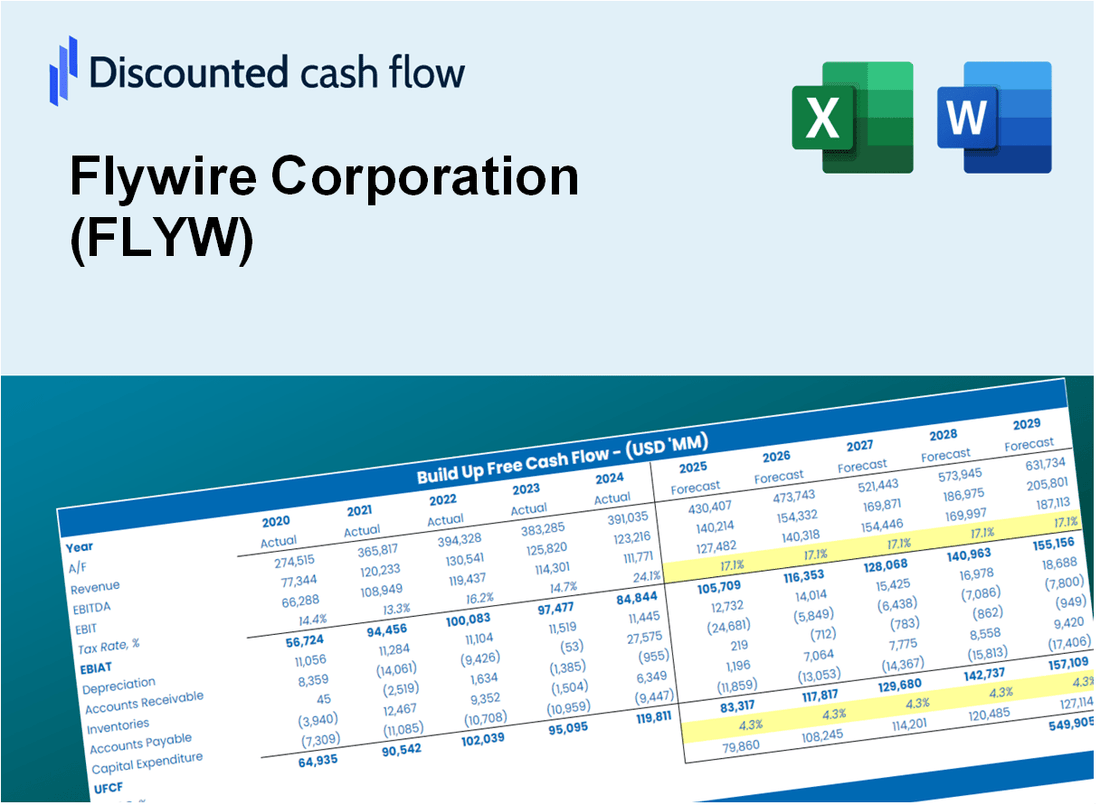
Discounted Cash Flow (DCF) - (USD MM)
| Year | AY1 2020 |
AY2 2021 |
AY3 2022 |
AY4 2023 |
AY5 2024 |
FY1 2025 |
FY2 2026 |
FY3 2027 |
FY4 2028 |
FY5 2029 |
|---|---|---|---|---|---|---|---|---|---|---|
| Revenue | 131.8 | 201.1 | 289.4 | 403.1 | 492.1 | 686.4 | 957.3 | 1,335.2 | 1,862.3 | 2,597.3 |
| Revenue Growth, % | 0 | 52.64 | 43.86 | 39.3 | 22.09 | 39.47 | 39.47 | 39.47 | 39.47 | 39.47 |
| EBITDA | -8.9 | -14.9 | -23.8 | 11.8 | 19.8 | -21.3 | -29.7 | -41.4 | -57.7 | -80.5 |
| EBITDA, % | -6.79 | -7.41 | -8.24 | 2.92 | 4.02 | -3.1 | -3.1 | -3.1 | -3.1 | -3.1 |
| Depreciation | 6.8 | 9.0 | 12.3 | 15.8 | 17.4 | 29.3 | 40.8 | 56.9 | 79.4 | 110.7 |
| Depreciation, % | 5.16 | 4.47 | 4.25 | 3.91 | 3.53 | 4.26 | 4.26 | 4.26 | 4.26 | 4.26 |
| EBIT | -15.7 | -23.9 | -36.1 | -4.0 | 2.4 | -50.6 | -70.5 | -98.3 | -137.1 | -191.3 |
| EBIT, % | -11.95 | -11.88 | -12.49 | -0.98736 | 0.48726 | -7.36 | -7.36 | -7.36 | -7.36 | -7.36 |
| Total Cash | 104.1 | 385.4 | 349.2 | 654.6 | 611.1 | 657.5 | 917.0 | 1,279.0 | 1,783.9 | 2,488.0 |
| Total Cash, percent | .0 | .0 | .0 | .0 | .0 | .0 | .0 | .0 | .0 | .0 |
| Account Receivables | 35.8 | 44.6 | 81.9 | 142.8 | 129.3 | 191.3 | 266.7 | 372.0 | 518.9 | 723.7 |
| Account Receivables, % | 27.13 | 22.17 | 28.31 | 35.44 | 26.27 | 27.86 | 27.86 | 27.86 | 27.86 | 27.86 |
| Inventories | 5.0 | 4.0 | 2.0 | .0 | .0 | 8.9 | 12.4 | 17.3 | 24.1 | 33.6 |
| Inventories, % | 3.79 | 1.99 | 0.69114 | 0 | 0 | 1.29 | 1.29 | 1.29 | 1.29 | 1.29 |
| Accounts Payable | 5.4 | 81.5 | 13.3 | 223.5 | 15.4 | 148.0 | 206.5 | 288.0 | 401.6 | 560.2 |
| Accounts Payable, % | 4.12 | 40.54 | 4.6 | 55.45 | 3.12 | 21.57 | 21.57 | 21.57 | 21.57 | 21.57 |
| Capital Expenditure | -2.1 | -6.7 | -7.1 | -6.0 | -.9 | -12.5 | -17.4 | -24.2 | -33.8 | -47.2 |
| Capital Expenditure, % | -1.62 | -3.32 | -2.45 | -1.49 | -0.18775 | -1.82 | -1.82 | -1.82 | -1.82 | -1.82 |
| Tax Rate, % | -55.91 | -55.91 | -55.91 | -55.91 | -55.91 | -55.91 | -55.91 | -55.91 | -55.91 | -55.91 |
| EBITAT | -9.6 | -25.9 | -38.1 | -7.8 | 3.7 | -46.6 | -65.0 | -90.6 | -126.4 | -176.3 |
| Depreciation | ||||||||||
| Changes in Account Receivables | ||||||||||
| Changes in Inventories | ||||||||||
| Changes in Accounts Payable | ||||||||||
| Capital Expenditure | ||||||||||
| UFCF | -40.2 | 44.7 | -136.4 | 153.2 | -174.4 | 32.0 | -62.1 | -86.6 | -120.8 | -168.5 |
| WACC, % | 9.84 | 9.85 | 9.85 | 9.85 | 9.85 | 9.85 | 9.85 | 9.85 | 9.85 | 9.85 |
| PV UFCF | ||||||||||
| SUM PV UFCF | -276.0 | |||||||||
| Long Term Growth Rate, % | 2.00 | |||||||||
| Free cash flow (T + 1) | -172 | |||||||||
| Terminal Value | -2,190 | |||||||||
| Present Terminal Value | -1,370 | |||||||||
| Enterprise Value | -1,646 | |||||||||
| Net Debt | -494 | |||||||||
| Equity Value | -1,152 | |||||||||
| Diluted Shares Outstanding, MM | 129 | |||||||||
| Equity Value Per Share | -8.91 |
What You Will Get
- Real FLYW Financial Data: Pre-filled with Flywire Corporation’s historical and projected data for precise analysis.
- Fully Editable Template: Modify key inputs like revenue growth, WACC, and EBITDA % with ease.
- Automatic Calculations: See Flywire Corporation’s intrinsic value update instantly based on your changes.
- Professional Valuation Tool: Designed for investors, analysts, and consultants seeking accurate DCF results.
- User-Friendly Design: Simple structure and clear instructions for all experience levels.
Key Features
- Comprehensive Financial Data: Flywire Corporation's historical financial statements and pre-filled projections.
- Customizable Parameters: Adjust WACC, tax rates, revenue growth, and EBITDA margins to fit your analysis.
- Real-Time Insights: Monitor Flywire's intrinsic value recalculating instantly.
- Intuitive Visualizations: Dashboard graphs showcase valuation results and essential metrics.
- Designed for Precision: A reliable tool tailored for analysts, investors, and finance professionals.
How It Works
- Download the Template: Get instant access to the Excel-based FLYW DCF Calculator.
- Input Your Assumptions: Adjust yellow-highlighted cells for growth rates, WACC, margins, and more.
- Instant Calculations: The model automatically updates Flywire Corporation’s intrinsic value.
- Test Scenarios: Simulate different assumptions to evaluate potential valuation changes.
- Analyze and Decide: Use the results to guide your investment or financial analysis.
Why Choose This Calculator for Flywire Corporation (FLYW)?
- User-Friendly Interface: Perfect for both novice users and seasoned professionals.
- Customizable Inputs: Adjust parameters effortlessly to suit your financial analysis.
- Real-Time Valuation: Observe immediate updates to Flywire’s valuation with any input changes.
- Preloaded Data: Comes equipped with Flywire’s latest financial metrics for swift evaluations.
- Relied Upon by Experts: Trusted by financial analysts and investors for making strategic decisions.
Who Should Use This Product?
- Individual Investors: Make informed decisions about buying or selling Flywire Corporation (FLYW) stock.
- Financial Analysts: Streamline valuation processes with ready-to-use financial models tailored for Flywire Corporation (FLYW).
- Consultants: Deliver professional valuation insights on Flywire Corporation (FLYW) to clients quickly and accurately.
- Business Owners: Understand how companies like Flywire Corporation (FLYW) are valued to guide your own strategic decisions.
- Finance Students: Learn valuation techniques using real-world data and scenarios related to Flywire Corporation (FLYW).
What the Flywire Template Contains
- Preloaded FLYW Data: Historical and projected financial information, including revenue, EBIT, and capital expenditures.
- DCF and WACC Models: Professional-grade sheets for determining intrinsic value and Weighted Average Cost of Capital.
- Editable Inputs: Yellow-highlighted cells for modifying revenue growth, tax rates, and discount rates.
- Financial Statements: Detailed annual and quarterly financials for in-depth analysis.
- Key Ratios: Profitability, leverage, and efficiency ratios for performance evaluation.
- Dashboard and Charts: Visual representations of valuation results and underlying assumptions.
Disclaimer
All information, articles, and product details provided on this website are for general informational and educational purposes only. We do not claim any ownership over, nor do we intend to infringe upon, any trademarks, copyrights, logos, brand names, or other intellectual property mentioned or depicted on this site. Such intellectual property remains the property of its respective owners, and any references here are made solely for identification or informational purposes, without implying any affiliation, endorsement, or partnership.
We make no representations or warranties, express or implied, regarding the accuracy, completeness, or suitability of any content or products presented. Nothing on this website should be construed as legal, tax, investment, financial, medical, or other professional advice. In addition, no part of this site—including articles or product references—constitutes a solicitation, recommendation, endorsement, advertisement, or offer to buy or sell any securities, franchises, or other financial instruments, particularly in jurisdictions where such activity would be unlawful.
All content is of a general nature and may not address the specific circumstances of any individual or entity. It is not a substitute for professional advice or services. Any actions you take based on the information provided here are strictly at your own risk. You accept full responsibility for any decisions or outcomes arising from your use of this website and agree to release us from any liability in connection with your use of, or reliance upon, the content or products found herein.