
|
Landwirte & Merchants Bancorp, Inc. (FMAO) DCF -Bewertung |
Fully Editable: Tailor To Your Needs In Excel Or Sheets
Professional Design: Trusted, Industry-Standard Templates
Investor-Approved Valuation Models
MAC/PC Compatible, Fully Unlocked
No Expertise Is Needed; Easy To Follow
Farmers & Merchants Bancorp, Inc. (FMAO) Bundle
Entdecken Sie die finanziellen Aussichten der Landwirte & Merchants Bancorp, Inc. (FMAO) mit unserem benutzerfreundlichen DCF-Taschenrechner! Geben Sie Ihre Prognosen für Wachstum, Margen und Ausgaben ein, um den inneren Wert der Landwirte aufzudecken & Merchants Bancorp, Inc. (FMAO) und verbessern Ihren Investitionsansatz.
What You Will Get
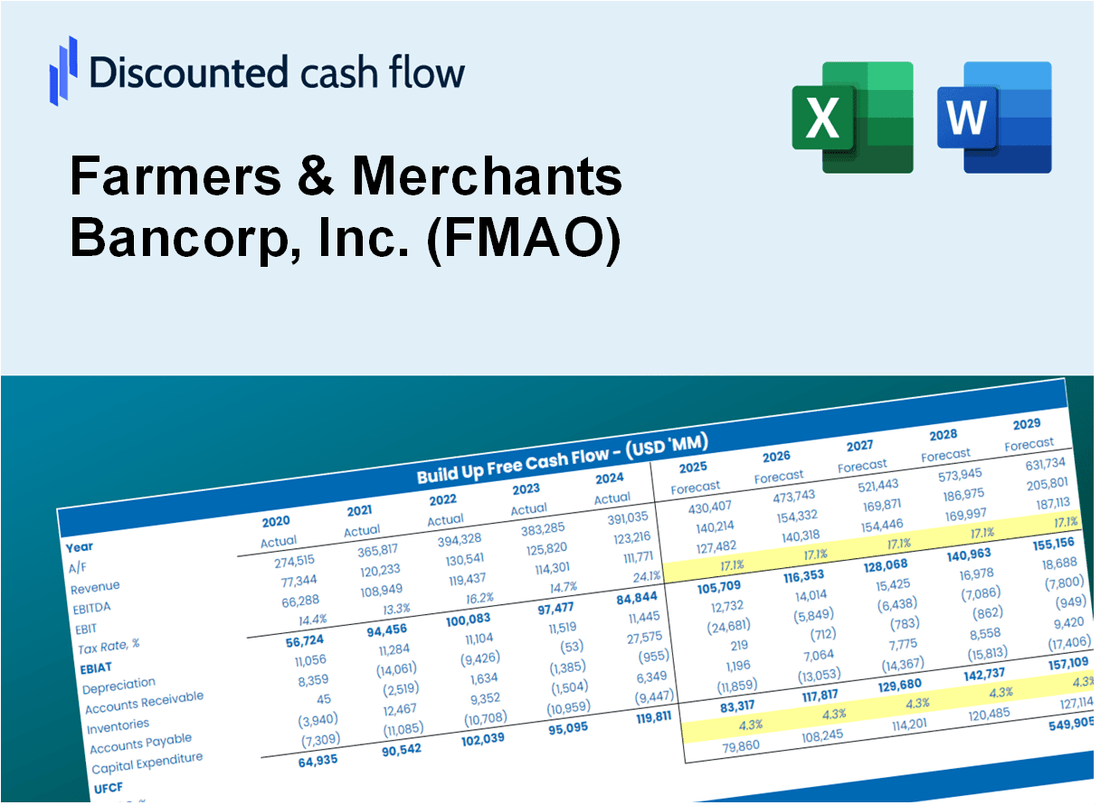
- Comprehensive FMAO Financials: Access to historical and projected data for precise valuation.
- Customizable Inputs: Adjust WACC, tax rates, revenue growth, and capital expenditures as needed.
- Dynamic Calculations: Intrinsic value and NPV are computed in real-time.
- Scenario Analysis: Explore various scenarios to assess Farmers & Merchants Bancorp's future performance.
- User-Friendly Interface: Designed for professionals while remaining approachable for newcomers.
Key Features
- Customizable Financial Inputs: Adjust essential metrics such as loan growth, net interest margin, and operating expenses.
- Instant DCF Valuation: Quickly computes intrinsic value, NPV, and other financial metrics.
- High-Precision Analytics: Leverages Farmers & Merchants Bancorp's (FMAO) actual financial data for accurate valuation results.
- Effortless Scenario Testing: Easily evaluate various assumptions and analyze different financial outcomes.
- Efficiency Boost: Streamline the valuation process without the hassle of constructing intricate models from the ground up.
How It Works
- Download the Template: Get instant access to the Excel-based FMAO DCF Calculator.
- Input Your Assumptions: Adjust the yellow-highlighted cells for growth rates, WACC, margins, and more.
- Instant Calculations: The model automatically updates Farmers & Merchants Bancorp's intrinsic value.
- Test Scenarios: Simulate different assumptions to evaluate potential valuation changes.
- Analyze and Decide: Use the results to guide your investment or financial analysis.
Why Choose This Calculator for Farmers & Merchants Bancorp, Inc. (FMAO)?
- Comprehensive Tool: Offers DCF, WACC, and financial ratio analyses tailored for FMAO.
- Customizable Inputs: Modify yellow-highlighted cells to explore different financial scenarios.
- Detailed Insights: Automatically computes the intrinsic value and Net Present Value for Farmers & Merchants Bancorp.
- Preloaded Data: Includes historical and forecasted data for precise analysis.
- Professional Quality: Perfect for financial analysts, investors, and consultants focusing on FMAO.
Who Should Use This Product?
- Investors: Evaluate Farmers & Merchants Bancorp, Inc. (FMAO)'s financial health before making investment decisions.
- CFOs and Financial Analysts: Optimize valuation methodologies and assess financial forecasts.
- Startup Founders: Understand the valuation strategies of established financial institutions like Farmers & Merchants Bancorp, Inc. (FMAO).
- Consultants: Provide comprehensive valuation analyses for clients in the banking sector.
- Students and Educators: Utilize current financial data to learn and teach valuation principles effectively.
What the Template Contains
- Pre-Filled DCF Model: Farmers & Merchants Bancorp, Inc.'s (FMAO) financial data preloaded for immediate use.
- WACC Calculator: Detailed calculations for Weighted Average Cost of Capital specific to (FMAO).
- Financial Ratios: Evaluate (FMAO)'s profitability, leverage, and efficiency metrics.
- Editable Inputs: Change assumptions such as growth, margins, and CAPEX to fit your scenarios for (FMAO).
- Financial Statements: Annual and quarterly reports for (FMAO) to support detailed analysis.
- Interactive Dashboard: Easily visualize key valuation metrics and results for (FMAO).
Disclaimer
All information, articles, and product details provided on this website are for general informational and educational purposes only. We do not claim any ownership over, nor do we intend to infringe upon, any trademarks, copyrights, logos, brand names, or other intellectual property mentioned or depicted on this site. Such intellectual property remains the property of its respective owners, and any references here are made solely for identification or informational purposes, without implying any affiliation, endorsement, or partnership.
We make no representations or warranties, express or implied, regarding the accuracy, completeness, or suitability of any content or products presented. Nothing on this website should be construed as legal, tax, investment, financial, medical, or other professional advice. In addition, no part of this site—including articles or product references—constitutes a solicitation, recommendation, endorsement, advertisement, or offer to buy or sell any securities, franchises, or other financial instruments, particularly in jurisdictions where such activity would be unlawful.
All content is of a general nature and may not address the specific circumstances of any individual or entity. It is not a substitute for professional advice or services. Any actions you take based on the information provided here are strictly at your own risk. You accept full responsibility for any decisions or outcomes arising from your use of this website and agree to release us from any liability in connection with your use of, or reliance upon, the content or products found herein.