
|
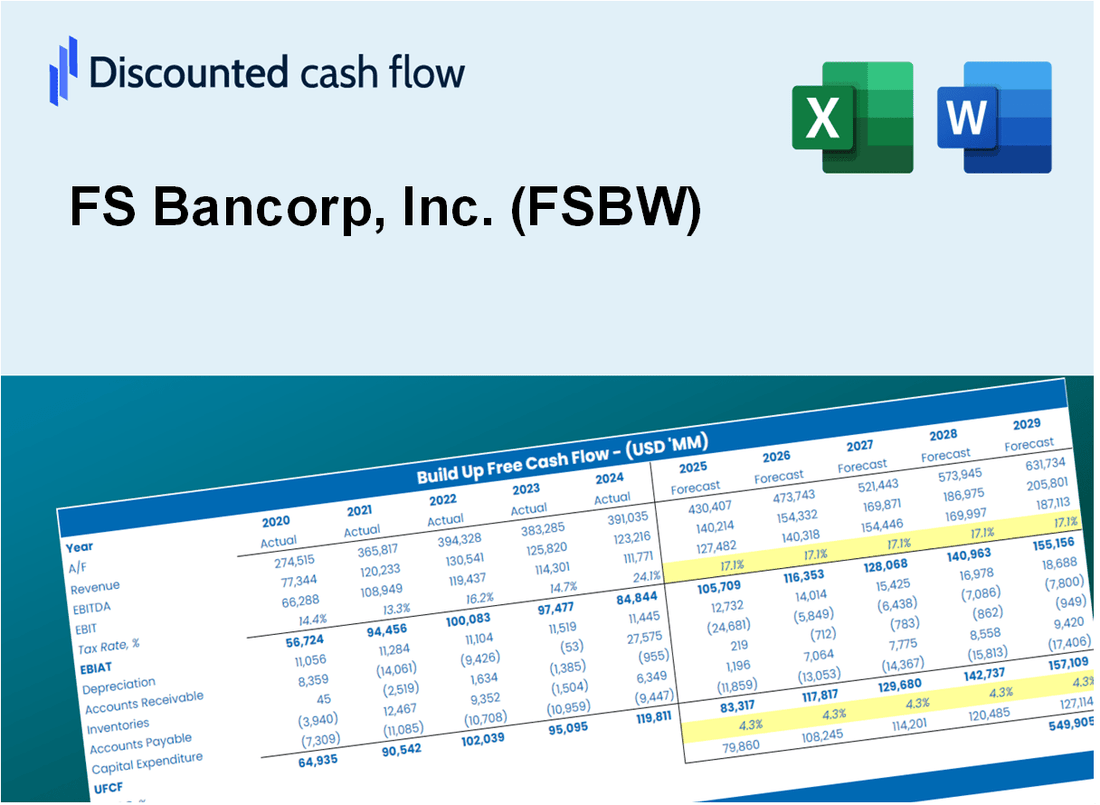
FS Bancorp, Inc. (FSBW) DCF -Bewertung |
Fully Editable: Tailor To Your Needs In Excel Or Sheets
Professional Design: Trusted, Industry-Standard Templates
Investor-Approved Valuation Models
MAC/PC Compatible, Fully Unlocked
No Expertise Is Needed; Easy To Follow
FS Bancorp, Inc. (FSBW) Bundle
Möchten Sie den inneren Wert von FS Bancorp, Inc. bestimmen? Unser (FSBW) DCF-Taschenrechner integriert reale Daten mit umfassenden Anpassungsfunktionen, sodass Sie Ihre Prognosen verfeinern und Ihre Anlagestrategien verbessern können.
What You Will Get
- Pre-Filled Financial Model: FS Bancorp’s actual data enables precise DCF valuation.
- Full Forecast Control: Adjust revenue growth, margins, WACC, and other key drivers.
- Instant Calculations: Automatic updates ensure you see results as you make changes.
- Investor-Ready Template: A refined Excel file designed for professional-grade valuation.
- Customizable and Reusable: Tailored for flexibility, allowing repeated use for detailed forecasts.
Key Features
- Accurate Financial Data: Gain access to reliable historical performance and future forecasts for FS Bancorp, Inc. (FSBW).
- Adjustable Forecast Parameters: Modify highlighted fields for key metrics such as WACC, growth rates, and profit margins.
- Real-Time Calculations: Automatic recalculations for DCF, Net Present Value (NPV), and cash flow assessments.
- Interactive Dashboard: User-friendly charts and summaries to help you visualize valuation outcomes.
- Designed for All Users: An intuitive layout suitable for investors, CFOs, and financial consultants alike.
How It Works
- 1. Access the Template: Download and open the Excel file containing FS Bancorp, Inc.'s (FSBW) financial data.
- 2. Modify Assumptions: Adjust key parameters such as growth rates, WACC, and capital expenditures.
- 3. Analyze Results in Real-Time: The DCF model automatically computes intrinsic value and NPV based on your inputs.
- 4. Explore Scenarios: Evaluate various forecasts to understand different valuation possibilities.
- 5. Present with Assurance: Share professional valuation analysis to bolster your financial decisions.
Why Choose FS Bancorp, Inc. (FSBW)?
- Time Efficiency: Skip the hassle of building financial models from the ground up – our tools are ready for immediate use.
- Enhanced Accuracy: Dependable financial data and methodologies minimize valuation errors.
- Completely Customizable: Adjust the model to align with your unique assumptions and forecasts.
- User-Friendly: Intuitive charts and outputs simplify result analysis.
- Endorsed by Professionals: Created for experts who prioritize precision and functionality.
Who Should Use This Product?
- Finance Students: Explore banking fundamentals and apply concepts using data from FS Bancorp, Inc. (FSBW).
- Academics: Integrate advanced banking models into your teaching or research projects.
- Investors: Validate your investment strategies and evaluate the financial performance of FS Bancorp, Inc. (FSBW).
- Analysts: Enhance your analysis with a ready-to-use, customizable financial model tailored for FS Bancorp, Inc. (FSBW).
- Small Business Owners: Understand how community banks like FS Bancorp, Inc. (FSBW) operate and are assessed.
What the Template Contains
- Pre-Filled Data: Includes FS Bancorp, Inc.'s (FSBW) historical financials and forecasts.
- Discounted Cash Flow Model: Editable DCF valuation model with automatic calculations tailored for FS Bancorp, Inc. (FSBW).
- Weighted Average Cost of Capital (WACC): A dedicated sheet for calculating WACC based on custom inputs specific to FS Bancorp, Inc. (FSBW).
- Key Financial Ratios: Analyze FS Bancorp, Inc.'s (FSBW) profitability, efficiency, and leverage.
- Customizable Inputs: Edit revenue growth, margins, and tax rates for FS Bancorp, Inc. (FSBW) with ease.
- Clear Dashboard: Charts and tables summarizing key valuation results for FS Bancorp, Inc. (FSBW).
Disclaimer
All information, articles, and product details provided on this website are for general informational and educational purposes only. We do not claim any ownership over, nor do we intend to infringe upon, any trademarks, copyrights, logos, brand names, or other intellectual property mentioned or depicted on this site. Such intellectual property remains the property of its respective owners, and any references here are made solely for identification or informational purposes, without implying any affiliation, endorsement, or partnership.
We make no representations or warranties, express or implied, regarding the accuracy, completeness, or suitability of any content or products presented. Nothing on this website should be construed as legal, tax, investment, financial, medical, or other professional advice. In addition, no part of this site—including articles or product references—constitutes a solicitation, recommendation, endorsement, advertisement, or offer to buy or sell any securities, franchises, or other financial instruments, particularly in jurisdictions where such activity would be unlawful.
All content is of a general nature and may not address the specific circumstances of any individual or entity. It is not a substitute for professional advice or services. Any actions you take based on the information provided here are strictly at your own risk. You accept full responsibility for any decisions or outcomes arising from your use of this website and agree to release us from any liability in connection with your use of, or reliance upon, the content or products found herein.