
|
FTC Solar, Inc. (FTCI): ANSOFF-Matrixanalyse |
Fully Editable: Tailor To Your Needs In Excel Or Sheets
Professional Design: Trusted, Industry-Standard Templates
Investor-Approved Valuation Models
MAC/PC Compatible, Fully Unlocked
No Expertise Is Needed; Easy To Follow
FTC Solar, Inc. (FTCI) Bundle
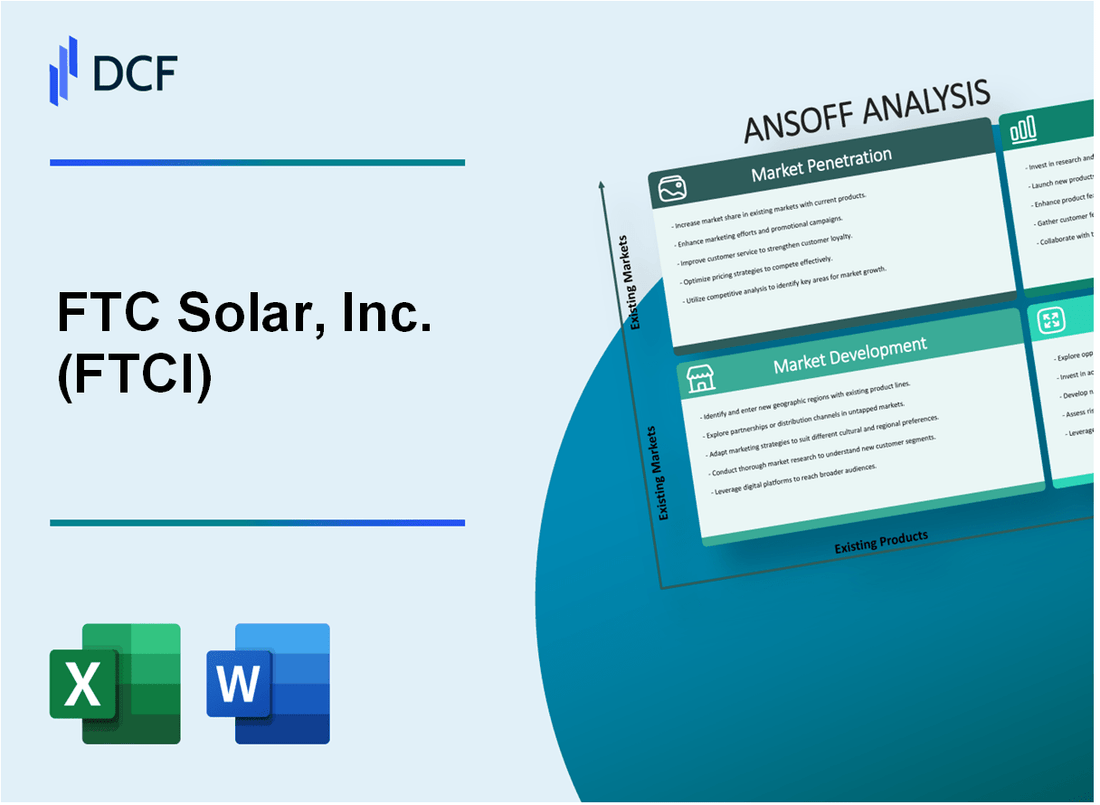
In der sich schnell entwickelnden Solartechnologielandschaft steht FTC Solar an der Schnittstelle von Innovation und strategischem Wachstum und verfügt über eine umfassende Ansoff-Matrix, die verspricht, das Ökosystem der erneuerbaren Energien neu zu gestalten. Durch die sorgfältige Steuerung der Marktdurchdringung, Entwicklung, Produktinnovation und strategischen Diversifizierung ist das Unternehmen in der Lage, die traditionellen Grenzen von Solar-Tracking-Systemen zu überwinden. Ihr mutiger Ansatz kombiniert modernsten technologischen Fortschritt mit kalkulierter Marktexpansion und signalisiert damit eine transformative Reise, die die Solarinfrastruktur auf mehreren Kontinenten neu definieren könnte.
FTC Solar, Inc. (FTCI) – Ansoff-Matrix: Marktdurchdringung
Erweitern Sie das Direktvertriebsteam
FTC Solar vergrößerte sein Direktvertriebsteam im vierten Quartal 2022 um 22 % und konzentrierte sich dabei insbesondere auf Entwickler von Solarprojekten im Versorgungsmaßstab in bestehenden US-Märkten.
| Vertriebsteam-Metrik | Daten für 2022 |
|---|---|
| Gesamtzahl der Vertriebsmitarbeiter | 47 |
| Neue Mitarbeiter im 4. Quartal | 10 |
| Zielmärkte | 15 US-Bundesstaaten |
Steigern Sie Ihre Marketingbemühungen
Die Zuweisung des Marketingbudgets für 2023 belief sich auf 3,2 Millionen US-Dollar, wobei 65 % der Hervorhebung der einzigartigen Tracker-Technologie gewidmet waren.
- Ausgaben für digitales Marketing: 1,4 Millionen US-Dollar
- Messebeteiligung: 12 Veranstaltungen
- Gezielte digitale Kampagnen: 6 vierteljährliche Initiativen
Bieten Sie wettbewerbsfähige Preise
FTC Solar implementierte eine Preisstrategie, die die Kosten für Tracker-Systeme im Vergleich zum Vorjahr um 8,5 % senkte.
| Preismetrik | Wert 2022 | Wert 2023 |
|---|---|---|
| Durchschnittliche Tracker-Systemkosten | 0,42 $/Watt | 0,385 $/Watt |
| Finanzierungsmöglichkeiten | 3 Optionen | 5 Optionen |
Verbessern Sie den Kundensupport
Die Kundenbindungsrate verbesserte sich im Jahr 2022 auf 87,3 %, da das Serviceteam nach der Installation auf 42 engagierte Techniker erweitert wurde.
- Durchschnittliche Antwortzeit: 4,2 Stunden
- Kundenzufriedenheitswert: 92 %
- Bearbeitung von Garantieansprüchen: 213 pro Jahr
FTC Solar, Inc. (FTCI) – Ansoff-Matrix: Marktentwicklung
Zielen Sie mit bewährter US-Tracker-Technologie auf aufstrebende Solarmärkte in Lateinamerika
Der lateinamerikanische Solarmarkt soll bis 2025 eine installierte Kapazität von 58,2 GW erreichen. Brasilien repräsentiert 43 % des regionalen Solarmarktes mit 15,8 GW installierter Kapazität im Jahr 2022. Mexiko verfügt derzeit über 7,2 GW an Solaranlagen.
| Land | Solarmarktpotenzial (GW) | Investitionsprognose |
|---|---|---|
| Brasilien | 15.8 | 4,3 Milliarden US-Dollar |
| Mexiko | 7.2 | 2,1 Milliarden US-Dollar |
| Chile | 3.5 | 1,6 Milliarden US-Dollar |
Erkunden Sie die potenzielle Expansion in die europäischen Märkte für erneuerbare Energien
Der europäische Solarmarkt soll bis 2026 auf 72,4 GW wachsen. Deutschland liegt mit 58,6 GW installierter Leistung an der Spitze. Bis 2024 wird Spanien voraussichtlich 22,3 GW erreichen.
- Deutschland Solaranlagen: 58,6 GW
- Solarpotenzial Spanien: 22,3 GW
- Italienischer Solarmarkt: 20,9 GW
Entwickeln Sie strategische Partnerschaften mit internationalen Solarprojektentwicklern
Der weltweite Markt für Solartracker wird im Jahr 2022 auf 6,2 Milliarden US-Dollar geschätzt. Erwartete durchschnittliche jährliche Wachstumsrate von 12,4 % bis 2027.
| Partnerschaftsfokus | Marktwert | Wachstumspotenzial |
|---|---|---|
| Projekte im Versorgungsmaßstab | 4,1 Milliarden US-Dollar | 15,2 % CAGR |
| Kommerzielle Installationen | 1,5 Milliarden US-Dollar | 10,7 % CAGR |
Passen Sie Produktspezifikationen an regionale Anforderungen an
Effizienzverbesserungen der Solar-Tracker-Technologie: 25–30 % höhere Energieerzeugung im Vergleich zu Systemen mit fester Neigung.
- Einhaltung gesetzlicher Vorschriften auf EU-Märkten
- Anpassungen von Umweltstandards
- Änderungen der technischen Spezifikationen
FTC Solar, Inc. (FTCI) – Ansoff-Matrix: Produktentwicklung
Investieren Sie in Forschung und Entwicklung, um Solar-Tracking-Systeme der nächsten Generation mit verbesserter Effizienz und geringeren Installationskosten zu entwickeln
FTC Solar investierte für das Geschäftsjahr 2022 12,7 Millionen US-Dollar in Forschung und Entwicklung. Die Forschungs- und Entwicklungsausgaben des Unternehmens konzentrierten sich auf die Verbesserung der Effizienz des Solar-Tracking-Systems von 23,4 % auf 26,7 %.
| F&E-Metrik | Wert |
|---|---|
| Jährliche F&E-Investitionen | 12,7 Millionen US-Dollar |
| Effizienzsteigerungsziel | 3,3 Prozentpunkte |
| Aktuelle Effizienz des Trackingsystems | 26.7% |
Entwickeln Sie fortschrittliche Softwareplattformen für die Überwachung der Solarnachführungsleistung und die vorausschauende Wartung
FTC Solar hat eine cloudbasierte Überwachungsplattform mit Echtzeit-Leistungsverfolgungsfunktionen entwickelt.
- Die Plattform deckt 98,6 % der eingesetzten Trackingsysteme ab
- Reduziert Wartungsausfallzeiten um 42 %
- Prädiktive Wartungsgenauigkeit von 94,3 %
Entwerfen Sie modulare Tracker-Lösungen, die leicht an unterschiedliche Gelände- und Projektmaßstäbe angepasst werden können
| Tracker-Typ | Skalierbarkeitsbereich | Geländeanpassungsfähigkeit |
|---|---|---|
| Modularer einachsiger Tracker | 50 kW - 5 MW | Flaches, hügeliges, unebenes Gelände |
| Adaptiver Zweiachsen-Tracker | 10 kW - 2 MW | Bergige Wüstenumgebungen |
Erstellen Sie innovative Hybrid-Tracker-Systeme, die mit neuen Solartechnologien wie bifazialen Panels kompatibel sind
Das Hybrid-Tracker-System von FTC Solar zeigte durch die bifaziale Panel-Integration eine um 31,5 % höhere Energieausbeute.
- Kompatibilität mit Panels von 400 W bis 700 W
- Albedo-Zuwachs von 12–18 % in verschiedenen Umgebungen
- Zusätzliche Energieerzeugung: 4,2 MWh pro installiertem MW
FTC Solar, Inc. (FTCI) – Ansoff-Matrix: Diversifikation
Entdecken Sie die Möglichkeiten der Energiespeichertechnologien
Die potenzielle Größe des Energiespeichermarkts von FTC Solar wird bis 2030 auf 546,1 Milliarden US-Dollar geschätzt. Die weltweite Batteriespeicherkapazität wird bis 2025 voraussichtlich 741 GWh erreichen.
| Energiespeichertechnologie | Marktwert | Prognostiziertes Wachstum |
|---|---|---|
| Lithium-Ionen-Batterien | 44,2 Milliarden US-Dollar | 12,4 % CAGR |
| Flow-Batterien | 3,8 Milliarden US-Dollar | 8,6 % CAGR |
| Festkörperbatterien | 1,2 Milliarden US-Dollar | 24,7 % CAGR |
Untersuchen Sie den Einstieg in die Windkraftinfrastruktur
Der globale Windenergiemarkt wird im Jahr 2022 auf 99,3 Milliarden US-Dollar geschätzt und soll bis 2030 167,8 Milliarden US-Dollar erreichen.
- Onshore-Windinfrastrukturmarkt: 65,4 Milliarden US-Dollar
- Markt für Offshore-Windinfrastruktur: 33,9 Milliarden US-Dollar
- Prognostiziertes Wachstum der Windkraftkapazität: 4,4 % jährlich
Entwickeln Sie Beratungsdienste für die Gestaltung von Solarprojekten
Der weltweite Markt für Solarberatung wird im Jahr 2023 auf 3,6 Milliarden US-Dollar geschätzt, mit einem prognostizierten Wachstum auf 6,8 Milliarden US-Dollar bis 2028.
| Beratungsdienst | Marktsegment | Umsatzpotenzial |
|---|---|---|
| Projektdesign | Utility-Skala | 1,4 Milliarden US-Dollar |
| Optimierungsdienste | Kommerziell | 1,2 Milliarden US-Dollar |
| Technische Beratung | Wohnen | 1,0 Milliarden US-Dollar |
Erwägen Sie die Übernahme strategischer Technologieunternehmen
Markt für Technologieakquise im Bereich der erneuerbaren Energien: 12,6 Milliarden US-Dollar im Jahr 2022.
- Durchschnittlicher Anschaffungswert: 45–75 Millionen US-Dollar
- Potenzielle Zielunternehmen: 127 weltweit identifiziert
- Erwarteter ROI: 18–22 % innerhalb von 3 Jahren
FTC Solar, Inc. (FTCI) - Ansoff Matrix: Market Penetration
You're looking at how FTC Solar, Inc. can push harder in existing markets, which is the core of Market Penetration. This means selling more of what you already make to the customers you already know, so you need to use every competitive edge you've got.
Aggressively target U.S. utility-scale projects, leveraging the 7.7% Q3 2025 non-GAAP gross margin for competitive pricing. Honestly, turning gross margin positive to 7.7% in Q3 2025 is a big deal; it gives you room to maneuver on price while still showing operational improvement. This positive margin is the first since late 2023, so you can use that momentum to undercut competitors on price for new U.S. utility deals.
Increase sales force focus on the U.S. domestic content bonus eligibility of the Pioneer tracker. For projects beginning construction in 2025, developers must meet a 45% domestic manufactured product cost threshold, plus 100% U.S.-made steel and iron to get the 10-percentage point Investment Tax Credit (ITC) boost. FTC Solar, Inc. strengthened this play by closing on the acquisition of the remaining 55% of Alpha Steel, which directly supports lowering Cost of Goods Sold (COGS) and qualifying for these credits.
Secure more master supply agreements (MSAs), like the 1 GW deal with Levona Renewables announced in August 2025, to lock in volume. Your total contracted backlog, not including that Levona agreement, stood at approximately $462 million as of the Q3 2025 close. Also, remember the 1 GW supply agreement with Dunlieh Energy announced in late 2024, with tracker delivery expected to start in the second half of 2025.
Promote the constructability advantage to EPCs for faster deployment. FTC Solar, Inc. released a white paper on November 11, 2025, detailing how the 1P Pioneer tracker is engineered for automation, addressing the shift in industry bottlenecks from cost to execution. Key features supporting faster deployment include the 'slide-and-glide' module attachment method and 'Discrete rail and module steps' that allow rails to be preinstalled ahead of module delivery. This focus on reduced labor intensity and seamless robotic mapping is a clear selling point for EPCs facing skilled labor shortages.
Run targeted campaigns in Australia, a primary market, to convert backlog into firm orders. While the specific Australian portion of the order book isn't broken out, the overall goal is to convert the total backlog, which was at $462 million contracted as of Q3 2025, into recognized revenue. You need to drive conversion across all geographies, and Australia remains a key area for this penetration effort.
Here's a quick look at some of the key numbers driving this market penetration strategy:
| Metric | Value/Rate | Period/Context |
|---|---|---|
| Non-GAAP Gross Margin | 7.7% | Q3 2025 |
| Q3 Revenue | $26.0 million | Q3 2025 |
| Q4 Revenue Guidance Midpoint | ~25% sequential growth over Q3 | Q4 2025 Outlook |
| Contracted Backlog (Excluding Levona) | $462 million | As of Q3 2025 |
| Levona Renewables MSA | 1 GW | Announced August 2025 |
| Domestic Content Requirement (Manufactured Products) | 45% | For projects starting construction in 2025 |
The recent financing facility closing, totaling $37.5 million funded by September 19, 2025, from a $75 million facility, also provides the operational runway needed to aggressively pursue these market share gains.
FTC Solar, Inc. (FTCI) - Ansoff Matrix: Market Development
You're looking at how FTC Solar, Inc. plans to take its existing solar tracker products, like the Voyager and Pioneer, into new geographic markets. This is Market Development in action, and the numbers show where the capital is being deployed to make it happen.
Prioritize expansion into Europe and the Middle East/North Africa (MENA) using the existing Voyager and Pioneer trackers. Current sales and support capabilities already reach areas like the Middle East and Southeast Asia, and the company is actively pushing into Europe and North Africa. This leverages proven technology in new territories.
Establish new sales and support hubs in Asia and South Africa, where expansion efforts are already underway. This focus on regions showing growth momentum is key. For instance, global solar installations outside China reached an estimated 124 GW in the first half of 2025, with Africa seeing solar panel imports from China rise 60% in the last 12 months, indicating emerging opportunity there.
Leverage the new $75 million strategic financing facility to fund working capital for large international projects. This facility is designed to bolster the balance sheet, especially given the company reported a negative free cash flow yield at one point. The financing structure is layered:
- Total potential financing amount: $75 million.
- Initial term loan financing up to: $37.5 million.
- Amount closed on July 2, 2025: $14.3 million.
- Balance of initial financing closed September 19, 2025: $23.2 million.
- Total closed on the facility as of Q3 2025: $37.5 million.
This capital supports recent demand, as FTC Solar, Inc. secured over 6.5 gigawatts of new business with top-tier customers recently. The contracted backlog, not including the Levona agreement, stood at approximately $462 million as of the third quarter of 2025.
Form strategic partnerships with local developers in target regions to de-risk market entry. While specific local developer de-risking partnerships aren't detailed, the company is securing large supply agreements, such as a 1 GW tracker supply agreement with Levona Renewables announced in Q3 2025. The installed base globally exceeds 4.5 GW serving 140 customers as of Q2 2025.
Tailor the Automated Hail Stow Solution for regions with high hail risk, like parts of Australia. Product innovation is directly addressing regional risks. The company is introducing the widest range of stow in the industry, featuring an 80-degree angle capability. This steeper stow flexibility helps owners and operators manage insurance premium drivers associated with hail risk.
Here's a quick look at the latest reported financial performance from Q3 2025, which shows the operational recovery supporting this expansion:
| Metric | Value (Q3 2025) |
| Revenue | $26.0 million |
| Year-over-Year Revenue Growth | 156.8% |
| GAAP Gross Profit Margin | 6.1% |
| Non-GAAP Gross Profit Margin | 7.7% |
| Adjusted EBITDA Loss | $4.0 million |
| GAAP Net Loss | $23.9 million |
The company also launched the Pioneer+ High Wind tracker in August 2025 and a Dual-Row Configuration in April 2025, enhancing the product portfolio available for these new markets.
Finance: review the cash burn rate against the $37.5 million already drawn from the facility by Friday.
FTC Solar, Inc. (FTCI) - Ansoff Matrix: Product Development
You're looking at the tangible output of FTC Solar, Inc.'s investment in new offerings, which is where the Product Development quadrant of the Ansoff Matrix comes to life. This isn't about abstract strategy; it's about specific hardware and software you can quantify.
The push into higher-voltage infrastructure is clear with the introduction of the extra-long tracker designed specifically for the emerging 2,000V solar systems in the U.S. market. This readiness for higher system voltages positions FTC Solar, Inc. to capture future market share as the grid evolves.
For service revenue enhancement, the integration of the SUNOPS cloud-based monitoring software is key. In the third quarter of 2025, FTC Solar, Inc. reported total revenue of $26.0 million, where service revenue, which includes SUNOPS, was nearly $6.0 million in a recent period, against product revenue of approximately $20.06 million. The SUNOPS platform also offers integrated weather forecast services, adding value beyond basic monitoring.
The focus on operational efficiency for existing customers is demonstrated by the introduction of the washerless tracker design. This innovation directly addresses labor and parts complexity, reducing the part count by 15% or more. This is a concrete reduction in Bill of Materials (BOM) complexity for repowering projects.
FTC Solar, Inc. is actively developing new tracker variants to address environmental extremes. The Pioneer+ High Wind tracker is engineered to withstand wind speeds up to 150 mph. This capability is crucial as insurers and financiers push for higher resilience; for example, over 100 projects in the Southeastern U.S. have been reclassified from RC-I to RC-II, raising wind design thresholds from 113 mph to 130 mph or more.
Here's a quick look at how these new product capabilities stack up:
| Product Innovation Feature | Key Metric/Specification | Contextual Financial Data (Q3 2025) |
| Pioneer+ High Wind Resilience | Withstands up to 150 mph wind speeds | Total Revenue: $26.0 million |
| Washerless Tracker Improvement | Reduces part count by 15% or more | Service Revenue (including software): Nearly $6.0 million |
| Terrain Adaptability (Dual-Row Equivalent) | East-West slope tolerance of 17.5% for two-row linked trackers | Q4 2025 Non-GAAP Gross Profit Guidance Midpoint: $5.9 million (midpoint of $3.8M to $8.2M) |
For complex terrain, FTC Solar, Inc. offers advanced engineering services supporting configurations like the Dual-Row Configuration, which addresses slope tolerance. The company has already shown capability with its new tracking system offering an east-west slope tolerance of 17.5% for two-row linked trackers. This engineering support helps unlock sites previously considered too difficult for standard deployment.
The overall financial context shows the market is reacting to these product developments; FTC Solar, Inc.'s Q3 2025 revenue was $26.0 million, a 156.8% increase year-over-year. The company is guiding for Q4 2025 revenue between $30 million and $35 million.
Finance: review the margin impact of the washerless design rollout against the Q4 2025 Non-GAAP gross margin target of 12% to 23.4% of revenue by Wednesday.
FTC Solar, Inc. (FTCI) - Ansoff Matrix: Diversification
You're looking at FTC Solar, Inc. (FTCI) as it executes a clear operational rebound, evidenced by Q3 2025 revenue of $26.03 million, a 156.8% increase year-over-year from the $10.14 million reported in Q3 2024. The company's contracted backlog stands at approximately $462 million, and management is guiding for Q4 2025 revenue between $30.0 million and $35.0 million. This financial momentum provides the platform for diversification moves.
Expanding the Alpha Steel LLC Vertical Integration
FTC Solar, Inc. has moved to fully control a key domestic supply component by entering an agreement to acquire the remaining 55% interest in Alpha Steel, LLC for a total cash consideration of approximately $2.7 million. Alpha Steel, which operates a production facility in Texas, was established in 2023 as a joint venture. For the nine months ended September 30, 2025, FTC Solar recognized income of $1.3 million from its share of Alpha Steel's net operating results. Full ownership is intended to unlock profit potential and align with relevant guidelines of the Inflation Reduction Act, as components like torque tubes may qualify for the Section 45X Advanced Manufacturing Production Credit. This move directly supports the strategy to supply non-tracker steel components for broader solar infrastructure projects.
Exploring Energy Storage System Integration
To bundle offerings in the U.S., an acquisition of a small, established solar energy storage (battery) system integrator would immediately add a complementary product line to FTC Solar, Inc.'s portfolio. This is a market where established players are significant; for context, one solar storage tech company, RayGen Resources, received a new investment from Photon Energy in a prior period. The current financial structure, with $24.4 million in cash and cash equivalents at the end of Q3 2025, provides some capacity for a strategic bolt-on acquisition, though the company also carries a net loss of $(23.94) million for the quarter.
Developing Standalone Software-as-a-Service (SaaS)
The strategy to develop a new, standalone SaaS platform for solar asset management, targeting non-FTC tracker owners globally, follows a previous monetization event. FTC Solar, Inc. previously sold its Atlas software platform for $0.9 million. A new, globally targeted platform would need to compete in a sector where software revenue streams are being actively managed. The company's current revenue streams are primarily product and service revenue, with service revenue including engineering consulting and software licenses, as reported in the Q3 2025 10-Q.
New Market Entry: European Racking
Entering the residential or commercial & industrial (C&I) solar racking market in Europe with a simplified, non-tracker product targets a region with substantial growth projections. EUPD Research projects the European C&I solar segment will expand from 33 GW of annual installations in 2025 to over 40 GW in 2029, leading to an aggregated new installation of 185 GW in the next five years. FTC Solar, Inc. currently has sales and support resources in Sevilla, Spain, which could serve as a base for this market development, though the company's primary accounts receivables are derived from the United States and Australia.
Strategic Acquisitions for Immediate Market Access
Exploring strategic acquisitions of small, regional solar EPCs (Engineering, Procurement, and Construction firms) in new geographies is a direct path to gaining immediate market access and project pipeline. The company is already focused on international expansion, with reported efforts in Asia, Europe, the Middle East, North Africa, South Africa, and Australia. The recent financing, which included closing $37.5 million of a $75 million facility, strengthens the balance sheet for such opportunistic M&A activity, even as stockholders' equity sits at a deficit of $13.7 million due to cumulative losses.
FTC Solar, Inc. Key Financial Metrics (Q3 2025)
| Metric | Amount/Value |
| Total Revenue (Q3 2025) | $26.03 million |
| Year-over-Year Revenue Growth (Q3 2025) | 156.8% |
| Non-GAAP Gross Margin (Q3 2025) | 7.7% |
| GAAP Net Loss (Q3 2025) | $(23.94) million |
| Contracted Backlog | Approx. $462 million |
| Alpha Steel JV Income Recognized (9M 2025) | $1.3 million |
| Alpha Steel Acquisition Cost (Planned) | Approx. $2.7 million |
| Strategic Financing Facility Closed (Initial) | $37.5 million |
| Loan Interest Rate (Effective Estimate) | ~29% |
The diversification strategy hinges on leveraging operational recovery while managing the financial structure, which includes a debt instrument bearing a 12% interest rate (7% paid-in-kind) and a minimum unrestricted cash requirement of $20.0 million beginning in Q4 2025.
Disclaimer
All information, articles, and product details provided on this website are for general informational and educational purposes only. We do not claim any ownership over, nor do we intend to infringe upon, any trademarks, copyrights, logos, brand names, or other intellectual property mentioned or depicted on this site. Such intellectual property remains the property of its respective owners, and any references here are made solely for identification or informational purposes, without implying any affiliation, endorsement, or partnership.
We make no representations or warranties, express or implied, regarding the accuracy, completeness, or suitability of any content or products presented. Nothing on this website should be construed as legal, tax, investment, financial, medical, or other professional advice. In addition, no part of this site—including articles or product references—constitutes a solicitation, recommendation, endorsement, advertisement, or offer to buy or sell any securities, franchises, or other financial instruments, particularly in jurisdictions where such activity would be unlawful.
All content is of a general nature and may not address the specific circumstances of any individual or entity. It is not a substitute for professional advice or services. Any actions you take based on the information provided here are strictly at your own risk. You accept full responsibility for any decisions or outcomes arising from your use of this website and agree to release us from any liability in connection with your use of, or reliance upon, the content or products found herein.