
|
FTC Solar, Inc. (FTCI) DCF -Bewertung |
Fully Editable: Tailor To Your Needs In Excel Or Sheets
Professional Design: Trusted, Industry-Standard Templates
Investor-Approved Valuation Models
MAC/PC Compatible, Fully Unlocked
No Expertise Is Needed; Easy To Follow
FTC Solar, Inc. (FTCI) Bundle
Verbessern Sie Ihre Investitionsauswahl mit dem DCF -Taschenrechner des FTC Solar, Inc. (FTCI)! Erforschen Sie echte Finanzdaten, passen Sie Wachstumsprojektionen und -kosten an und beachten Sie sofort, wie sich diese Veränderungen auf den inneren Wert von FTC Solar, Inc. (FTCI) auswirken.
What You Will Get
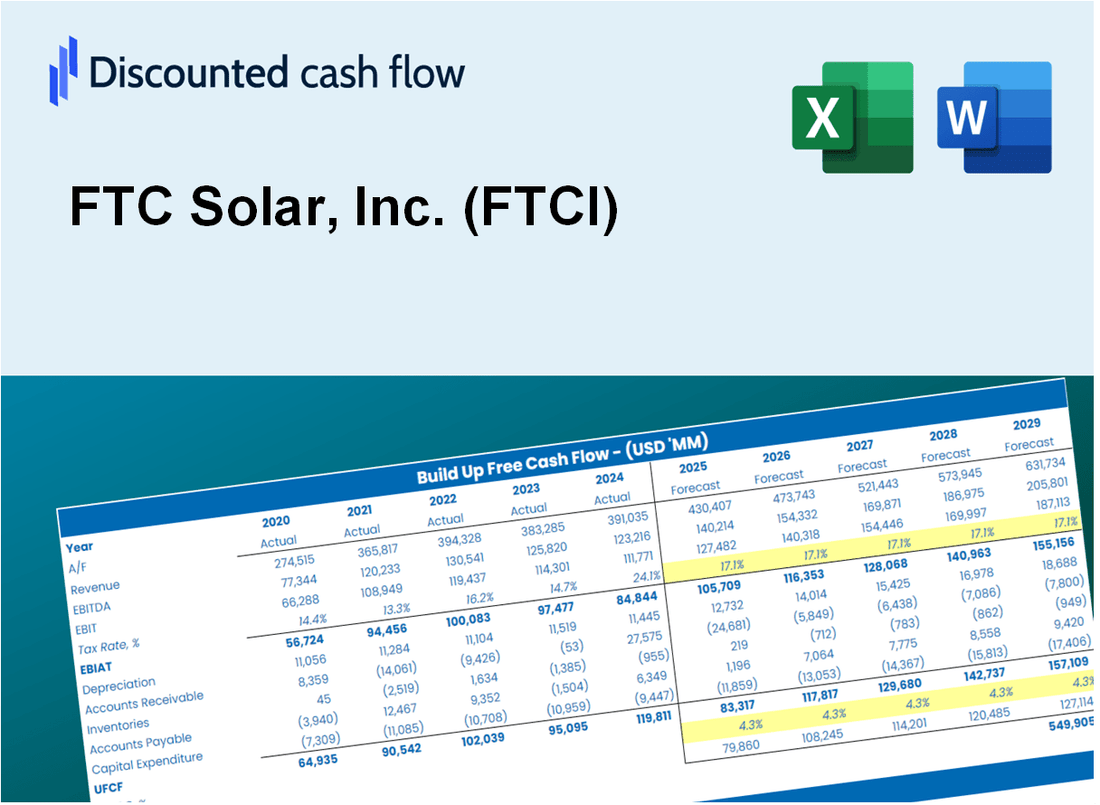
- Comprehensive FTCI Financials: Access historical and projected data for precise valuation.
- Customizable Inputs: Adjust WACC, tax rates, revenue growth, and capital expenditures as needed.
- Dynamic Calculations: Intrinsic value and NPV are computed in real-time.
- Scenario Analysis: Evaluate various scenarios to assess FTC Solar's future performance.
- User-Friendly Design: Designed for professionals while remaining approachable for newcomers.
Key Features
- Customizable Energy Inputs: Adjust essential parameters such as solar panel efficiency, installation costs, and maintenance expenses.
- Instant DCF Valuation: Quickly computes intrinsic value, NPV, and other financial metrics for your analysis.
- High-Precision Results: Leverages FTC Solar's real-world financial data for accurate valuation projections.
- Simplified Scenario Testing: Easily explore various assumptions and analyze different outcomes.
- Efficiency Booster: Streamlines the valuation process by removing the need for intricate model development.
How It Works
- Step 1: Download the Excel file.
- Step 2: Review pre-entered FTC Solar, Inc. (FTCI) data (historical and projected).
- Step 3: Adjust key assumptions (yellow cells) based on your analysis.
- Step 4: View automatic recalculations for FTC Solar, Inc. (FTCI)’s intrinsic value.
- Step 5: Use the outputs for investment decisions or reporting.
Why Choose This Calculator for FTC Solar, Inc. (FTCI)?
- User-Friendly Interface: Perfect for both novices and seasoned professionals.
- Customizable Inputs: Adjust parameters to tailor your analysis to FTC Solar’s specifics.
- Real-Time Feedback: Observe immediate updates to FTC Solar’s valuation as you change inputs.
- Pre-Loaded Data: Comes with FTC Solar’s latest financial information for swift evaluations.
- Relied Upon by Experts: A go-to tool for investors and analysts seeking reliable insights.
Who Should Use This Product?
- Renewable Energy Students: Explore solar energy concepts and apply them using real-world data.
- Researchers: Integrate advanced solar technology models into academic studies or projects.
- Investors: Evaluate your investment strategies and analyze the performance of FTC Solar, Inc. (FTCI).
- Energy Analysts: Enhance your analysis with a customizable model tailored for solar energy companies.
- Entrepreneurs: Understand how public companies like FTC Solar, Inc. (FTCI) are valued in the renewable energy sector.
What the Template Contains
- Preloaded FTCI Data: Historical and projected financial data, including revenue, EBIT, and capital expenditures.
- DCF and WACC Models: Professional-grade sheets for calculating intrinsic value and Weighted Average Cost of Capital.
- Editable Inputs: Yellow-highlighted cells for adjusting revenue growth, tax rates, and discount rates.
- Financial Statements: Comprehensive annual and quarterly financials for deeper analysis.
- Key Ratios: Profitability, leverage, and efficiency ratios to evaluate performance.
- Dashboard and Charts: Visual summaries of valuation outcomes and assumptions.
Disclaimer
All information, articles, and product details provided on this website are for general informational and educational purposes only. We do not claim any ownership over, nor do we intend to infringe upon, any trademarks, copyrights, logos, brand names, or other intellectual property mentioned or depicted on this site. Such intellectual property remains the property of its respective owners, and any references here are made solely for identification or informational purposes, without implying any affiliation, endorsement, or partnership.
We make no representations or warranties, express or implied, regarding the accuracy, completeness, or suitability of any content or products presented. Nothing on this website should be construed as legal, tax, investment, financial, medical, or other professional advice. In addition, no part of this site—including articles or product references—constitutes a solicitation, recommendation, endorsement, advertisement, or offer to buy or sell any securities, franchises, or other financial instruments, particularly in jurisdictions where such activity would be unlawful.
All content is of a general nature and may not address the specific circumstances of any individual or entity. It is not a substitute for professional advice or services. Any actions you take based on the information provided here are strictly at your own risk. You accept full responsibility for any decisions or outcomes arising from your use of this website and agree to release us from any liability in connection with your use of, or reliance upon, the content or products found herein.