
|
Fulton Financial Corporation (FULT) DCF -Bewertung |
Fully Editable: Tailor To Your Needs In Excel Or Sheets
Professional Design: Trusted, Industry-Standard Templates
Investor-Approved Valuation Models
MAC/PC Compatible, Fully Unlocked
No Expertise Is Needed; Easy To Follow
Fulton Financial Corporation (FULT) Bundle
Vereinfachen Sie die Bewertung der Fulton Financial Corporation (FULT) mit diesem anpassbaren DCF -Taschenrechner! Mit Real Fulton Financial Corporation (FULT) -Fonds und einstellbaren Prognoseeingaben können Sie Szenarien testen und Fulton Financial Corporation (FULT) in wenigen Minuten aufdecken.
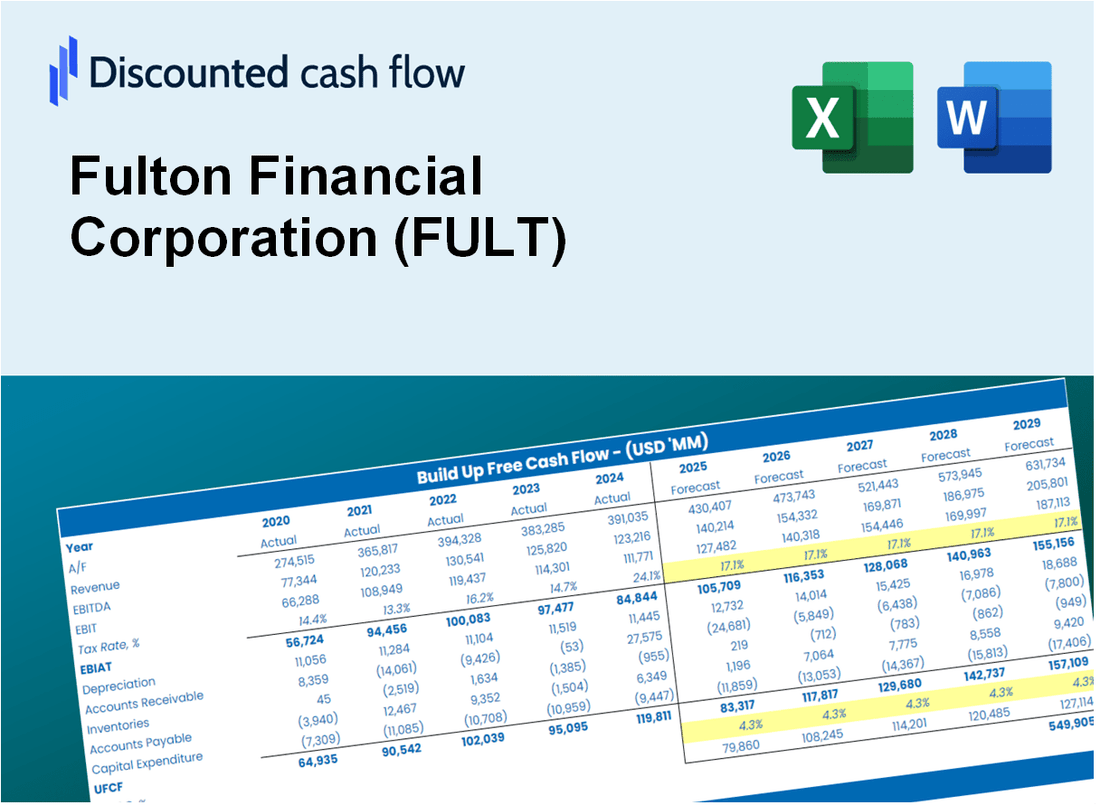
Discounted Cash Flow (DCF) - (USD MM)
| Year | AY1 2020 |
AY2 2021 |
AY3 2022 |
AY4 2023 |
AY5 2024 |
FY1 2025 |
FY2 2026 |
FY3 2027 |
FY4 2028 |
FY5 2029 |
|---|---|---|---|---|---|---|---|---|---|---|
| Revenue | 972.3 | 997.2 | 1,092.0 | 1,500.9 | 1,800.7 | 2,113.5 | 2,480.6 | 2,911.6 | 3,417.4 | 4,011.1 |
| Revenue Growth, % | 0 | 2.56 | 9.51 | 37.45 | 19.97 | 17.37 | 17.37 | 17.37 | 17.37 | 17.37 |
| EBITDA | 231.6 | 363.6 | 378.9 | 381.7 | 401.6 | 603.3 | 708.1 | 831.1 | 975.5 | 1,145.0 |
| EBITDA, % | 23.82 | 36.47 | 34.7 | 25.43 | 22.3 | 28.54 | 28.54 | 28.54 | 28.54 | 28.54 |
| Depreciation | 29.3 | 29.4 | 31.9 | 33.0 | 57.0 | 60.2 | 70.7 | 83.0 | 97.4 | 114.3 |
| Depreciation, % | 3.02 | 2.95 | 2.92 | 2.2 | 3.17 | 2.85 | 2.85 | 2.85 | 2.85 | 2.85 |
| EBIT | 202.2 | 334.2 | 347.0 | 348.7 | 344.6 | 543.0 | 637.4 | 748.1 | 878.1 | 1,030.6 |
| EBIT, % | 20.8 | 33.52 | 31.78 | 23.23 | 19.14 | 25.69 | 25.69 | 25.69 | 25.69 | 25.69 |
| Total Cash | 4,910.0 | 4,826.0 | 3,314.8 | 2,930.7 | 3,371.0 | 2,113.5 | 2,480.6 | 2,911.6 | 3,417.4 | 4,011.1 |
| Total Cash, percent | .0 | .0 | .0 | .0 | .0 | .0 | .0 | .0 | .0 | .0 |
| Account Receivables | 350.7 | 334.0 | 410.5 | 478.9 | 465.2 | 697.0 | 818.1 | 960.2 | 1,127.0 | 1,322.8 |
| Account Receivables, % | 36.07 | 33.49 | 37.59 | 31.91 | 25.83 | 32.98 | 32.98 | 32.98 | 32.98 | 32.98 |
| Inventories | .0 | .0 | .0 | .0 | .0 | .0 | .0 | .0 | .0 | .0 |
| Inventories, % | 0 | 0 | 0 | 0 | 0 | 0 | 0 | 0 | 0 | 0 |
| Accounts Payable | 10.4 | 7.0 | 10.2 | 35.1 | 31.6 | 28.7 | 33.7 | 39.6 | 46.4 | 54.5 |
| Accounts Payable, % | 1.07 | 0.702 | 0.93272 | 2.34 | 1.76 | 1.36 | 1.36 | 1.36 | 1.36 | 1.36 |
| Capital Expenditure | -20.2 | -17.7 | -21.2 | -33.0 | -42.5 | -43.8 | -51.4 | -60.3 | -70.8 | -83.1 |
| Capital Expenditure, % | -2.08 | -1.77 | -1.95 | -2.2 | -2.36 | -2.07 | -2.07 | -2.07 | -2.07 | -2.07 |
| Tax Rate, % | 16.22 | 16.22 | 16.22 | 16.22 | 16.22 | 16.22 | 16.22 | 16.22 | 16.22 | 16.22 |
| EBITAT | 178.0 | 275.5 | 287.0 | 284.3 | 288.7 | 454.5 | 533.4 | 626.1 | 734.9 | 862.6 |
| Depreciation | ||||||||||
| Changes in Account Receivables | ||||||||||
| Changes in Inventories | ||||||||||
| Changes in Accounts Payable | ||||||||||
| Capital Expenditure | ||||||||||
| UFCF | -153.2 | 300.6 | 224.3 | 240.8 | 313.5 | 236.3 | 436.7 | 512.6 | 601.6 | 706.1 |
| WACC, % | 16.14 | 15.42 | 15.45 | 15.3 | 15.59 | 15.58 | 15.58 | 15.58 | 15.58 | 15.58 |
| PV UFCF | ||||||||||
| SUM PV UFCF | 1,542.7 | |||||||||
| Long Term Growth Rate, % | 2.00 | |||||||||
| Free cash flow (T + 1) | 720 | |||||||||
| Terminal Value | 5,303 | |||||||||
| Present Terminal Value | 2,571 | |||||||||
| Enterprise Value | 4,114 | |||||||||
| Net Debt | 722 | |||||||||
| Equity Value | 3,392 | |||||||||
| Diluted Shares Outstanding, MM | 177 | |||||||||
| Equity Value Per Share | 19.14 |
What You Will Get
- Genuine Fulton Data: Preloaded financials – from revenue to EBIT – based on actual and projected figures for Fulton Financial Corporation (FULT).
- Comprehensive Customization: Modify all essential parameters (yellow cells) such as WACC, growth %, and tax rates.
- Immediate Valuation Adjustments: Automatic recalculations to evaluate the effects of changes on Fulton Financial's fair value.
- Flexible Excel Template: Designed for quick modifications, scenario testing, and in-depth projections.
- Efficient and Precise: Avoid constructing models from the ground up while ensuring accuracy and adaptability.
Key Features
- Customizable Financial Inputs: Adjust essential parameters such as loan growth, net interest margin, and operating expenses.
- Instant DCF Valuation: Quickly computes intrinsic value, NPV, and other financial metrics.
- High-Precision Accuracy: Utilizes Fulton Financial Corporation’s actual financial data for credible valuation results.
- Streamlined Scenario Analysis: Easily evaluate various assumptions and analyze different outcomes.
- Efficiency Booster: Avoid the hassle of constructing intricate valuation models from the ground up.
How It Works
- Download the Template: Get instant access to the Excel-based FULT DCF Calculator.
- Input Your Assumptions: Adjust yellow-highlighted cells for growth rates, WACC, margins, and more.
- Instant Calculations: The model automatically updates Fulton Financial Corporation’s intrinsic value.
- Test Scenarios: Simulate different assumptions to evaluate potential valuation changes.
- Analyze and Decide: Use the results to guide your investment or financial analysis.
Why Choose This Calculator for Fulton Financial Corporation (FULT)?
- Designed for Experts: A sophisticated tool utilized by financial analysts, CFOs, and advisors.
- Accurate Financial Data: Historical and projected financials for Fulton Financial Corporation (FULT) preloaded for precision.
- Comprehensive Scenario Analysis: Effortlessly simulate various forecasts and assumptions.
- Detailed Outputs: Automatically computes intrinsic value, NPV, and essential financial metrics.
- User-Friendly: Step-by-step guidance makes the process straightforward.
Who Should Use This Product?
- Investors: Evaluate Fulton Financial Corporation’s valuation before making stock decisions.
- CFOs and Financial Analysts: Enhance valuation methodologies and assess financial forecasts.
- Startup Founders: Understand the valuation strategies of established financial institutions like Fulton Financial.
- Consultants: Create detailed valuation reports for your clientele.
- Students and Educators: Utilize current data to learn and teach valuation principles.
What the Template Contains
- Preloaded FULT Data: Historical and projected financial data, including revenue, EBIT, and capital expenditures.
- DCF and WACC Models: Professional-grade sheets for calculating intrinsic value and Weighted Average Cost of Capital.
- Editable Inputs: Yellow-highlighted cells for adjusting revenue growth, tax rates, and discount rates.
- Financial Statements: Comprehensive annual and quarterly financials for deeper analysis.
- Key Ratios: Profitability, leverage, and efficiency ratios to evaluate performance.
- Dashboard and Charts: Visual summaries of valuation outcomes and assumptions.
Disclaimer
All information, articles, and product details provided on this website are for general informational and educational purposes only. We do not claim any ownership over, nor do we intend to infringe upon, any trademarks, copyrights, logos, brand names, or other intellectual property mentioned or depicted on this site. Such intellectual property remains the property of its respective owners, and any references here are made solely for identification or informational purposes, without implying any affiliation, endorsement, or partnership.
We make no representations or warranties, express or implied, regarding the accuracy, completeness, or suitability of any content or products presented. Nothing on this website should be construed as legal, tax, investment, financial, medical, or other professional advice. In addition, no part of this site—including articles or product references—constitutes a solicitation, recommendation, endorsement, advertisement, or offer to buy or sell any securities, franchises, or other financial instruments, particularly in jurisdictions where such activity would be unlawful.
All content is of a general nature and may not address the specific circumstances of any individual or entity. It is not a substitute for professional advice or services. Any actions you take based on the information provided here are strictly at your own risk. You accept full responsibility for any decisions or outcomes arising from your use of this website and agree to release us from any liability in connection with your use of, or reliance upon, the content or products found herein.