
|
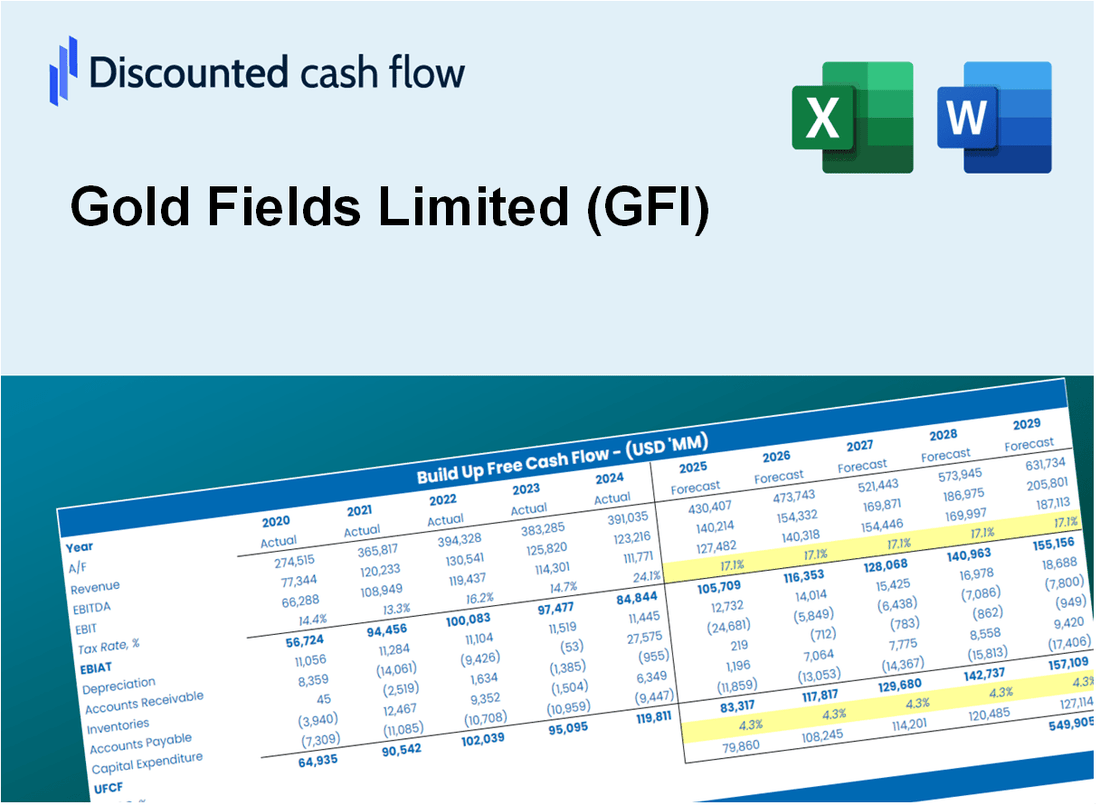
Gold Fields Limited (GFI) DCF -Bewertung |
Fully Editable: Tailor To Your Needs In Excel Or Sheets
Professional Design: Trusted, Industry-Standard Templates
Investor-Approved Valuation Models
MAC/PC Compatible, Fully Unlocked
No Expertise Is Needed; Easy To Follow
Gold Fields Limited (GFI) Bundle
Unabhängig davon, ob Sie ein Investor oder Analyst sind, ist dieser DCF -Taschenrechner für Gold Fields Limited (GFI) das perfekte Werkzeug für eine genaue Bewertung. Mit realen Daten von Gold Fields Limited, können Sie Prognosen anpassen und die Effekte in Echtzeit sehen.
What You Will Get
- Accurate GFI Financials: Access to historical and projected data for precise valuation.
- Customizable Inputs: Adjust parameters such as WACC, tax rates, revenue growth, and capital expenditures.
- Real-Time Calculations: Intrinsic value and NPV are computed automatically.
- Scenario Analysis: Evaluate various scenarios to assess Gold Fields Limited's future performance.
- User-Friendly Interface: Designed for industry professionals while remaining approachable for newcomers.
Key Features
- Comprehensive DCF Model: Offers detailed unlevered and levered DCF valuation frameworks tailored for Gold Fields Limited (GFI).
- WACC Analysis Tool: Features a pre-configured Weighted Average Cost of Capital sheet with adjustable parameters.
- Customizable Forecast Inputs: Easily alter growth projections, capital investments, and discount rates.
- Integrated Financial Ratios: Evaluate profitability, leverage, and operational efficiency ratios specific to Gold Fields Limited (GFI).
- Interactive Dashboard and Graphs: Visual representations that condense essential valuation metrics for straightforward analysis.
How It Works
- Step 1: Download the Excel file.
- Step 2: Review pre-entered Gold Fields Limited (GFI) data (historical and projected).
- Step 3: Adjust key assumptions (yellow cells) based on your analysis.
- Step 4: View automatic recalculations for Gold Fields Limited’s intrinsic value.
- Step 5: Use the outputs for investment decisions or reporting.
Why Choose This Calculator for Gold Fields Limited (GFI)?
- Reliable Data: Access up-to-date financial information specific to Gold Fields Limited for accurate valuation.
- Customizable Inputs: Tailor essential parameters such as growth rates, WACC, and tax rates to align with your forecasts.
- Efficiency Boost: Built-in calculations save you the hassle of starting from the ground up.
- Professional-Grade Resource: Ideal for investors, analysts, and consultants focusing on Gold Fields Limited.
- User-Friendly Interface: Easy-to-navigate design and clear instructions cater to users of all experience levels.
Who Should Use This Product?
- Investors: Accurately assess Gold Fields Limited’s (GFI) intrinsic value before making investment choices.
- CFOs: Utilize a high-quality DCF model for financial reporting and strategic analysis related to Gold Fields Limited (GFI).
- Consultants: Efficiently customize the template for valuation reports tailored to Gold Fields Limited (GFI) clients.
- Entrepreneurs: Acquire insights into the financial modeling practices employed by leading mining companies like Gold Fields Limited (GFI).
- Educators: Implement it as a resource for teaching valuation techniques in the context of Gold Fields Limited (GFI).
What the Template Contains
- Comprehensive DCF Model: Editable template with detailed valuation calculations for Gold Fields Limited (GFI).
- Real-World Data: Gold Fields Limited’s historical and projected financials preloaded for analysis.
- Customizable Parameters: Adjust WACC, growth rates, and tax assumptions to test various scenarios for (GFI).
- Financial Statements: Full annual and quarterly breakdowns for deeper insights into Gold Fields Limited (GFI).
- Key Ratios: Built-in analysis for profitability, efficiency, and leverage specific to (GFI).
- Dashboard with Visual Outputs: Charts and tables for clear, actionable results related to Gold Fields Limited (GFI).
Disclaimer
All information, articles, and product details provided on this website are for general informational and educational purposes only. We do not claim any ownership over, nor do we intend to infringe upon, any trademarks, copyrights, logos, brand names, or other intellectual property mentioned or depicted on this site. Such intellectual property remains the property of its respective owners, and any references here are made solely for identification or informational purposes, without implying any affiliation, endorsement, or partnership.
We make no representations or warranties, express or implied, regarding the accuracy, completeness, or suitability of any content or products presented. Nothing on this website should be construed as legal, tax, investment, financial, medical, or other professional advice. In addition, no part of this site—including articles or product references—constitutes a solicitation, recommendation, endorsement, advertisement, or offer to buy or sell any securities, franchises, or other financial instruments, particularly in jurisdictions where such activity would be unlawful.
All content is of a general nature and may not address the specific circumstances of any individual or entity. It is not a substitute for professional advice or services. Any actions you take based on the information provided here are strictly at your own risk. You accept full responsibility for any decisions or outcomes arising from your use of this website and agree to release us from any liability in connection with your use of, or reliance upon, the content or products found herein.