|
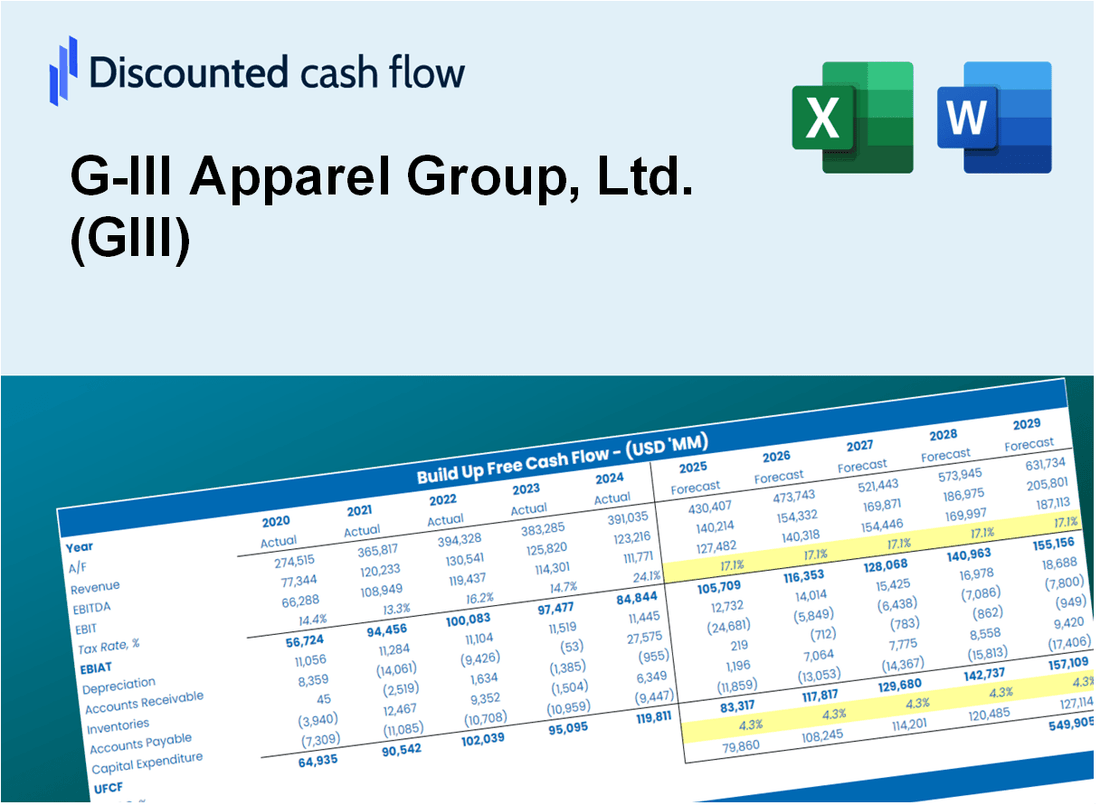
G-III Bekleidungsgruppe, Ltd. (GIII) DCF-Bewertung |
Fully Editable: Tailor To Your Needs In Excel Or Sheets
Professional Design: Trusted, Industry-Standard Templates
Investor-Approved Valuation Models
MAC/PC Compatible, Fully Unlocked
No Expertise Is Needed; Easy To Follow
G-III Apparel Group, Ltd. (GIII) Bundle
Möchten Sie den inneren Wert der G-III-Bekleidungsgruppe, Ltd., bewerten? Unser GIII-DCF-Taschenrechner integriert reale Daten mit umfangreichen Anpassungsfunktionen, sodass Sie Prognosen anpassen und Ihre Anlagestrategien verbessern können.
What You Will Receive
- Pre-Filled Financial Model: G-III Apparel Group’s actual data facilitates accurate DCF valuation.
- Comprehensive Forecast Control: Modify revenue growth, margins, WACC, and other essential drivers.
- Instantaneous Calculations: Automatic updates provide real-time results as you make adjustments.
- Investor-Ready Template: A polished Excel file crafted for professional-level valuation.
- Customizable and Reusable: Designed for versatility, enabling repeated use for in-depth forecasts.
Key Features
- Accurate G-III Financials: Access reliable pre-loaded historical data and future projections for G-III Apparel Group, Ltd. (GIII).
- Customizable Forecast Assumptions: Modify highlighted cells such as WACC, growth rates, and profit margins to suit your analysis.
- Dynamic Calculations: Automatic updates for DCF, Net Present Value (NPV), and cash flow assessments.
- Visual Dashboard: User-friendly charts and summaries to help you visualize your valuation outcomes.
- Designed for All Users: An intuitive layout tailored for investors, CFOs, and consultants alike.
How It Works
- Download the Template: Gain immediate access to the Excel-based G-III Apparel DCF Calculator.
- Input Your Assumptions: Modify the yellow-highlighted cells for growth rates, WACC, margins, and other variables.
- Instant Calculations: The model will automatically refresh G-III Apparel's intrinsic value.
- Test Scenarios: Experiment with various assumptions to assess potential valuation shifts.
- Analyze and Decide: Utilize the findings to inform your investment or financial assessments.
Why Choose This Calculator for G-III Apparel Group, Ltd. (GIII)?
- User-Friendly Interface: Perfectly crafted for both novice and experienced users.
- Customizable Inputs: Adjust parameters easily to suit your specific analysis.
- Real-Time Adjustments: Observe immediate changes to G-III's valuation as you modify inputs.
- Preloaded Data: Comes with G-III's actual financial metrics for swift evaluations.
- Relied Upon by Experts: A go-to tool for investors and analysts aiming for well-informed choices.
Who Should Use This Product?
- Investors: Accurately estimate G-III Apparel Group, Ltd.’s (GIII) fair value before making investment decisions.
- CFOs: Leverage a professional-grade DCF model for financial reporting and analysis specific to GIII.
- Consultants: Quickly adapt the template for valuation reports tailored to G-III Apparel Group, Ltd. (GIII) clients.
- Entrepreneurs: Gain insights into financial modeling practices utilized by leading apparel companies like GIII.
- Educators: Use it as a teaching tool to demonstrate valuation methodologies relevant to the apparel industry.
What the G-III Apparel Group, Ltd. (GIII) Template Contains
- Comprehensive DCF Model: Editable template featuring in-depth valuation calculations tailored for G-III Apparel Group.
- Real-World Data: G-III Apparel Group’s historical and projected financials preloaded for thorough analysis.
- Customizable Parameters: Modify WACC, growth rates, and tax assumptions to explore various scenarios.
- Financial Statements: Complete annual and quarterly breakdowns for enhanced insights into G-III Apparel Group's performance.
- Key Ratios: Integrated analysis for profitability, efficiency, and leverage specific to G-III Apparel Group.
- Dashboard with Visual Outputs: Visual representations such as charts and tables for clear, actionable insights.
Disclaimer
All information, articles, and product details provided on this website are for general informational and educational purposes only. We do not claim any ownership over, nor do we intend to infringe upon, any trademarks, copyrights, logos, brand names, or other intellectual property mentioned or depicted on this site. Such intellectual property remains the property of its respective owners, and any references here are made solely for identification or informational purposes, without implying any affiliation, endorsement, or partnership.
We make no representations or warranties, express or implied, regarding the accuracy, completeness, or suitability of any content or products presented. Nothing on this website should be construed as legal, tax, investment, financial, medical, or other professional advice. In addition, no part of this site—including articles or product references—constitutes a solicitation, recommendation, endorsement, advertisement, or offer to buy or sell any securities, franchises, or other financial instruments, particularly in jurisdictions where such activity would be unlawful.
All content is of a general nature and may not address the specific circumstances of any individual or entity. It is not a substitute for professional advice or services. Any actions you take based on the information provided here are strictly at your own risk. You accept full responsibility for any decisions or outcomes arising from your use of this website and agree to release us from any liability in connection with your use of, or reliance upon, the content or products found herein.