
|
Genworth Financial, Inc. (GNW) DCF -Bewertung |
Fully Editable: Tailor To Your Needs In Excel Or Sheets
Professional Design: Trusted, Industry-Standard Templates
Investor-Approved Valuation Models
MAC/PC Compatible, Fully Unlocked
No Expertise Is Needed; Easy To Follow
Genworth Financial, Inc. (GNW) Bundle
Streamline Genworth Financial, Inc. (GNW) Bewertung mit diesem anpassbaren DCF -Taschenrechner! Mit Real Genworth Financial, Inc. (GNW) Finanzdaten und einstellbaren Prognoseeingaben können Sie Szenarien testen und Genworth Financial, Inc. (GNW) in Minuten aufdecken.
What You Will Get
- Editable Excel Template: A fully customizable Excel-based DCF Calculator featuring pre-filled real GNW financials.
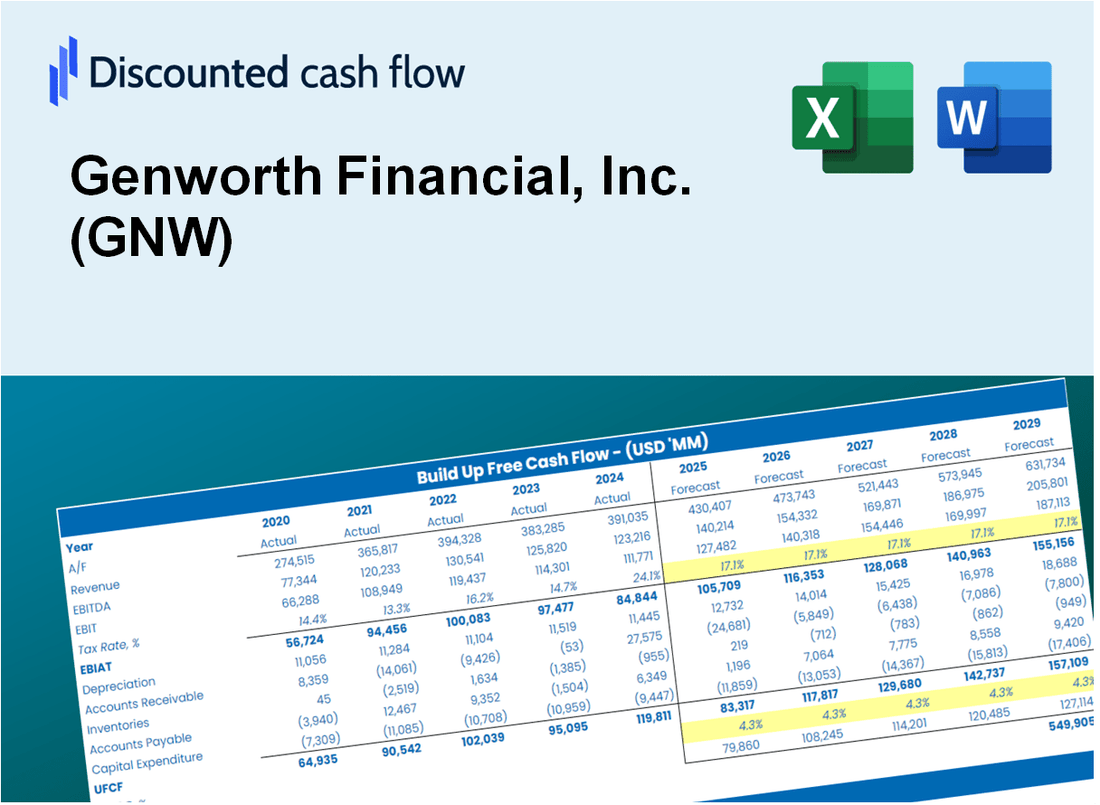
- Real-World Data: Historical data and forward-looking estimates (as indicated in the yellow cells).
- Forecast Flexibility: Adjust forecast assumptions such as revenue growth, EBITDA %, and WACC.
- Automatic Calculations: Instantly observe the effect of your inputs on Genworth Financial’s valuation.
- Professional Tool: Designed for investors, CFOs, consultants, and financial analysts.
- User-Friendly Design: Organized for clarity and ease of use, complete with step-by-step instructions.
Key Features
- Real-Life GNW Data: Pre-filled with Genworth Financial’s historical financials and forward-looking projections.
- Fully Customizable Inputs: Adjust revenue growth, margins, WACC, tax rates, and capital expenditures.
- Dynamic Valuation Model: Automatic updates to Net Present Value (NPV) and intrinsic value based on your inputs.
- Scenario Testing: Create multiple forecast scenarios to analyze different valuation outcomes.
- User-Friendly Design: Simple, structured, and designed for professionals and beginners alike.
How It Works
- Step 1: Download the prebuilt Excel template featuring Genworth Financial’s data included.
- Step 2: Review the pre-filled sheets to grasp the essential metrics.
- Step 3: Modify forecasts and assumptions in the editable yellow cells (WACC, growth, margins).
- Step 4: Instantly see the recalculated results, including Genworth Financial’s intrinsic value.
- Step 5: Make well-informed investment choices or create reports using the outputs.
Why Choose This Calculator for Genworth Financial, Inc. (GNW)?
- All-in-One Solution: Combines DCF, WACC, and financial ratio analyses tailored for Genworth.
- Flexible Inputs: Modify the highlighted cells to explore different financial scenarios.
- In-Depth Analysis: Automatically computes Genworth's intrinsic value and Net Present Value.
- Preloaded Information: Historical and projected data provide reliable starting figures.
- Expert-Level Tool: Perfect for financial analysts, investors, and business consultants focusing on Genworth.
Who Should Use This Product?
- Investors: Accurately assess Genworth Financial’s fair value before making investment decisions.
- CFOs: Utilize a professional-grade DCF model for financial reporting and analysis.
- Consultants: Easily customize the template for valuation reports tailored to clients.
- Entrepreneurs: Gain insights into financial modeling practices used by leading financial firms.
- Educators: Employ it as a teaching resource to illustrate valuation methodologies.
What the Template Contains
- Comprehensive DCF Model: Editable template featuring detailed valuation calculations specific to Genworth Financial, Inc. (GNW).
- Real-World Data: Genworth’s historical and projected financials preloaded for thorough analysis.
- Customizable Parameters: Modify WACC, growth rates, and tax assumptions to explore various scenarios.
- Financial Statements: Complete annual and quarterly breakdowns for enhanced insights into performance.
- Key Ratios: Integrated analysis for profitability, efficiency, and leverage metrics.
- Dashboard with Visual Outputs: Charts and tables designed for clear, actionable results.
Disclaimer
All information, articles, and product details provided on this website are for general informational and educational purposes only. We do not claim any ownership over, nor do we intend to infringe upon, any trademarks, copyrights, logos, brand names, or other intellectual property mentioned or depicted on this site. Such intellectual property remains the property of its respective owners, and any references here are made solely for identification or informational purposes, without implying any affiliation, endorsement, or partnership.
We make no representations or warranties, express or implied, regarding the accuracy, completeness, or suitability of any content or products presented. Nothing on this website should be construed as legal, tax, investment, financial, medical, or other professional advice. In addition, no part of this site—including articles or product references—constitutes a solicitation, recommendation, endorsement, advertisement, or offer to buy or sell any securities, franchises, or other financial instruments, particularly in jurisdictions where such activity would be unlawful.
All content is of a general nature and may not address the specific circumstances of any individual or entity. It is not a substitute for professional advice or services. Any actions you take based on the information provided here are strictly at your own risk. You accept full responsibility for any decisions or outcomes arising from your use of this website and agree to release us from any liability in connection with your use of, or reliance upon, the content or products found herein.