
|
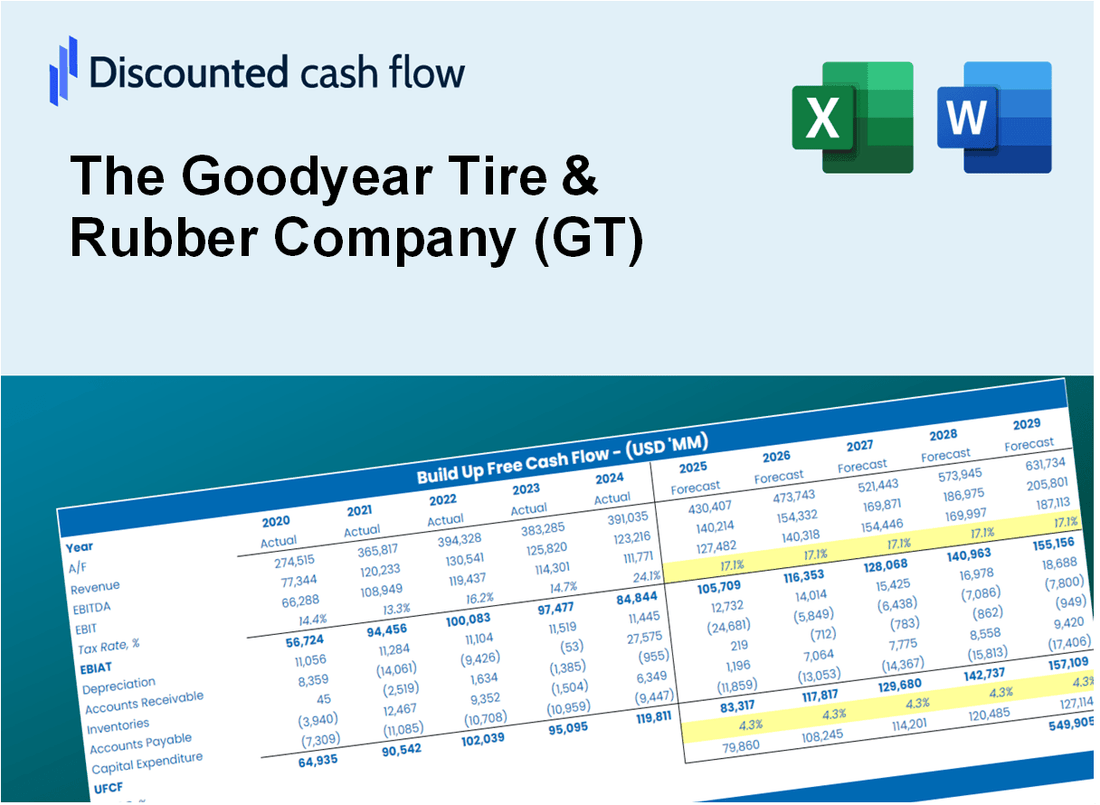
Der Goodyear -Reifen & DCF -Bewertung von Gummi Company (GT) |
Fully Editable: Tailor To Your Needs In Excel Or Sheets
Professional Design: Trusted, Industry-Standard Templates
Investor-Approved Valuation Models
MAC/PC Compatible, Fully Unlocked
No Expertise Is Needed; Easy To Follow
The Goodyear Tire & Rubber Company (GT) Bundle
Unser (GT) DCF -Taschenrechner für Genauigkeit entwickelt, ermöglicht es Ihnen, den Goodyear -Reifen zu bewerten & Die Bewertung des Gummiunternehmens unter Verwendung realer Finanzdaten und bietet vollständige Flexibilität, um alle wichtigen Parameter für verbesserte Projektionen zu ändern.
What You Will Get
- Real GT Financials: Access to historical and projected data for precise valuation.
- Customizable Inputs: Adjust WACC, tax rates, revenue growth, and capital expenditures as needed.
- Dynamic Calculations: Intrinsic value and NPV are calculated in real-time.
- Scenario Analysis: Explore various scenarios to assess Goodyear’s future performance.
- User-Friendly Design: Designed for professionals while remaining approachable for newcomers.
Key Features
- Customizable Tire Specifications: Adjust key parameters such as tread depth, rubber composition, and performance metrics.
- Instant Tire Performance Analysis: Evaluates tire durability, fuel efficiency, and handling characteristics in real-time.
- Industry-Leading Precision: Incorporates Goodyear’s extensive testing data for accurate performance predictions.
- Comprehensive Scenario Testing: Explore various driving conditions and compare tire performance effortlessly.
- Efficiency Booster: Streamline the process of tire selection without the hassle of complex calculations.
How It Works
- Step 1: Download the Excel file.
- Step 2: Review pre-entered Goodyear data (historical and projected).
- Step 3: Adjust key assumptions (yellow cells) based on your analysis.
- Step 4: View automatic recalculations for Goodyear’s intrinsic value.
- Step 5: Use the outputs for investment decisions or reporting.
Why Choose This Calculator for Goodyear Tire & Rubber Company (GT)?
- Accurate Data: Up-to-date Goodyear financials provide trustworthy valuation outcomes.
- Customizable: Modify essential parameters such as growth rates, WACC, and tax rates to align with your forecasts.
- Time-Saving: Pre-configured calculations save you from having to build from the ground up.
- Professional-Grade Tool: Tailored for investors, analysts, and consultants in the tire industry.
- User-Friendly: Easy-to-navigate design and clear instructions ensure accessibility for all users.
Who Should Use This Product?
- Automotive Students: Understand tire technology and apply concepts using real-world data.
- Researchers: Utilize industry models in academic projects or studies related to tire manufacturing.
- Investors: Evaluate your investment strategies and analyze valuation metrics for Goodyear Tire & Rubber Company (GT).
- Market Analysts: Enhance your analysis with a customizable model specific to the tire industry.
- Fleet Managers: Learn how large corporations like Goodyear assess tire performance and durability.
What the Template Contains
- Comprehensive DCF Model: Editable template with detailed valuation calculations tailored for The Goodyear Tire & Rubber Company (GT).
- Real-World Data: Goodyear’s historical and projected financials preloaded for analysis.
- Customizable Parameters: Adjust WACC, growth rates, and tax assumptions to test various scenarios.
- Financial Statements: Full annual and quarterly breakdowns for deeper insights into Goodyear's performance.
- Key Ratios: Built-in analysis for profitability, efficiency, and leverage specific to Goodyear.
- Dashboard with Visual Outputs: Charts and tables for clear, actionable results related to Goodyear's financial health.
Disclaimer
All information, articles, and product details provided on this website are for general informational and educational purposes only. We do not claim any ownership over, nor do we intend to infringe upon, any trademarks, copyrights, logos, brand names, or other intellectual property mentioned or depicted on this site. Such intellectual property remains the property of its respective owners, and any references here are made solely for identification or informational purposes, without implying any affiliation, endorsement, or partnership.
We make no representations or warranties, express or implied, regarding the accuracy, completeness, or suitability of any content or products presented. Nothing on this website should be construed as legal, tax, investment, financial, medical, or other professional advice. In addition, no part of this site—including articles or product references—constitutes a solicitation, recommendation, endorsement, advertisement, or offer to buy or sell any securities, franchises, or other financial instruments, particularly in jurisdictions where such activity would be unlawful.
All content is of a general nature and may not address the specific circumstances of any individual or entity. It is not a substitute for professional advice or services. Any actions you take based on the information provided here are strictly at your own risk. You accept full responsibility for any decisions or outcomes arising from your use of this website and agree to release us from any liability in connection with your use of, or reliance upon, the content or products found herein.