
|
Home Bancorp, Inc. (HBCP) DCF -Bewertung |
Fully Editable: Tailor To Your Needs In Excel Or Sheets
Professional Design: Trusted, Industry-Standard Templates
Investor-Approved Valuation Models
MAC/PC Compatible, Fully Unlocked
No Expertise Is Needed; Easy To Follow
Home Bancorp, Inc. (HBCP) Bundle
Entdecken Sie das wahre Potenzial von Home Bancorp, Inc. (HBCP) mit unserem erweiterten DCF -Taschenrechner! Passen Sie die wichtigsten Annahmen an, erkunden Sie verschiedene Szenarien und untersuchen, wie sich Schwankungen auf die Bewertung von Home Bancorp, Inc. (HBCP) auswirken - alles innerhalb einer umfassenden Excel -Vorlage.
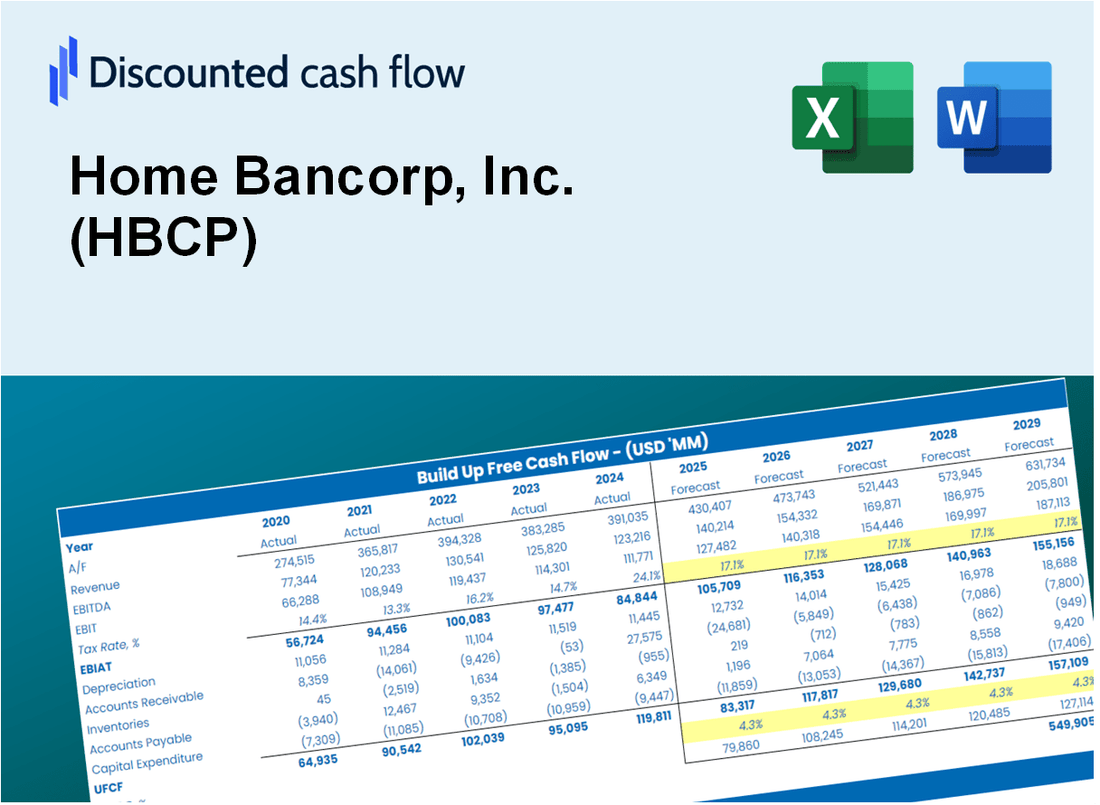
Discounted Cash Flow (DCF) - (USD MM)
| Year | AY1 2020 |
AY2 2021 |
AY3 2022 |
AY4 2023 |
AY5 2024 |
FY1 2025 |
FY2 2026 |
FY3 2027 |
FY4 2028 |
FY5 2029 |
|---|---|---|---|---|---|---|---|---|---|---|
| Revenue | 118.4 | 123.2 | 139.8 | 178.3 | 199.4 | 227.7 | 260.1 | 297.1 | 339.3 | 387.6 |
| Revenue Growth, % | 0 | 4 | 13.51 | 27.52 | 11.83 | 14.22 | 14.22 | 14.22 | 14.22 | 14.22 |
| EBITDA | 34.0 | 64.0 | 46.0 | 53.7 | 48.7 | 76.6 | 87.5 | 99.9 | 114.1 | 130.3 |
| EBITDA, % | 28.73 | 51.98 | 32.88 | 30.13 | 24.41 | 33.63 | 33.63 | 33.63 | 33.63 | 33.63 |
| Depreciation | 3.2 | 3.1 | 3.5 | 3.6 | 3.5 | 5.2 | 6.0 | 6.8 | 7.8 | 8.9 |
| Depreciation, % | 2.72 | 2.5 | 2.48 | 2 | 1.75 | 2.29 | 2.29 | 2.29 | 2.29 | 2.29 |
| EBIT | 30.8 | 60.9 | 42.5 | 50.1 | 45.2 | 71.4 | 81.5 | 93.1 | 106.3 | 121.4 |
| EBIT, % | 26.01 | 49.48 | 30.4 | 28.12 | 22.66 | 31.33 | 31.33 | 31.33 | 31.33 | 31.33 |
| Total Cash | 443.1 | 929.4 | 574.3 | 92.0 | 114.5 | 186.3 | 212.8 | 243.0 | 277.6 | 317.0 |
| Total Cash, percent | .0 | .0 | .0 | .0 | .0 | .0 | .0 | .0 | .0 | .0 |
| Account Receivables | 40.4 | 40.8 | 73.6 | .0 | .0 | 54.6 | 62.3 | 71.2 | 81.3 | 92.9 |
| Account Receivables, % | 34.09 | 33.09 | 52.63 | 0 | 0 | 23.96 | 23.96 | 23.96 | 23.96 | 23.96 |
| Inventories | .0 | .0 | .0 | .0 | .0 | .0 | .0 | .0 | .0 | .0 |
| Inventories, % | 0 | 0 | 0 | 0 | 0 | 0 | 0 | 0 | 0 | 0 |
| Accounts Payable | 21.8 | 18.9 | 29.4 | .0 | .0 | 25.0 | 28.5 | 32.6 | 37.2 | 42.5 |
| Accounts Payable, % | 18.43 | 15.35 | 21.01 | 0 | 0 | 10.96 | 10.96 | 10.96 | 10.96 | 10.96 |
| Capital Expenditure | -2.1 | -2.5 | -2.7 | -2.0 | -4.1 | -4.1 | -4.6 | -5.3 | -6.1 | -6.9 |
| Capital Expenditure, % | -1.81 | -2.01 | -1.94 | -1.13 | -2.03 | -1.78 | -1.78 | -1.78 | -1.78 | -1.78 |
| Tax Rate, % | 19.38 | 19.38 | 19.38 | 19.38 | 19.38 | 19.38 | 19.38 | 19.38 | 19.38 | 19.38 |
| EBITAT | 24.8 | 49.0 | 34.1 | 40.2 | 36.4 | 57.4 | 65.5 | 74.8 | 85.5 | 97.6 |
| Depreciation | ||||||||||
| Changes in Account Receivables | ||||||||||
| Changes in Inventories | ||||||||||
| Changes in Accounts Payable | ||||||||||
| Capital Expenditure | ||||||||||
| UFCF | 7.3 | 46.3 | 12.5 | 86.0 | 35.9 | 28.9 | 62.6 | 71.5 | 81.7 | 93.3 |
| WACC, % | 12.13 | 12.14 | 12.11 | 12.12 | 12.16 | 12.13 | 12.13 | 12.13 | 12.13 | 12.13 |
| PV UFCF | ||||||||||
| SUM PV UFCF | 230.6 | |||||||||
| Long Term Growth Rate, % | 2.00 | |||||||||
| Free cash flow (T + 1) | 95 | |||||||||
| Terminal Value | 939 | |||||||||
| Present Terminal Value | 530 | |||||||||
| Enterprise Value | 760 | |||||||||
| Net Debt | 137 | |||||||||
| Equity Value | 623 | |||||||||
| Diluted Shares Outstanding, MM | 8 | |||||||||
| Equity Value Per Share | 78.26 |
What You Will Receive
- Customizable Excel Template: A fully editable Excel-based DCF Calculator featuring pre-filled financials for Home Bancorp, Inc. (HBCP).
- Accurate Data: Historical performance data and future projections (highlighted in the yellow cells).
- Flexible Forecasting: Adjust key assumptions such as loan growth, net interest margin, and discount rates.
- Instant Calculations: Quickly observe how your inputs affect Home Bancorp's valuation.
- Professional Resource: Designed for investors, financial officers, consultants, and analysts.
- Intuitive Layout: Organized for simplicity and user-friendliness, complete with step-by-step guidance.
Key Features
- Comprehensive DCF Model: Offers detailed unlevered and levered DCF valuation frameworks tailored for Home Bancorp, Inc. (HBCP).
- WACC Estimator: Features a pre-configured Weighted Average Cost of Capital template with adjustable parameters.
- Customizable Forecast Inputs: Easily alter growth projections, capital investments, and discount rates.
- Integrated Financial Ratios: Evaluate profitability, leverage, and efficiency ratios specifically for Home Bancorp, Inc. (HBCP).
- Interactive Dashboard and Visuals: Graphical representations highlight essential valuation metrics for straightforward analysis.
How It Works
- 1. Access the Template: Download and open the Excel file featuring Home Bancorp, Inc.'s (HBCP) financial data.
- 2. Adjust Assumptions: Modify key parameters such as growth rates, WACC, and capital expenditures.
- 3. Instant Results: The DCF model automatically computes intrinsic value and NPV in real-time.
- 4. Evaluate Scenarios: Analyze various forecasts to explore different valuation possibilities.
- 5. Present with Assurance: Share expert valuation insights to bolster your decision-making process.
Why Choose This Calculator for Home Bancorp, Inc. (HBCP)?
- Designed for Finance Experts: A specialized tool utilized by financial analysts, CFOs, and investment consultants.
- Accurate Data Integration: Home Bancorp's historical and projected financials are preloaded for precise analysis.
- Flexible Scenario Analysis: Effortlessly simulate various forecasts and assumptions.
- Insightful Outputs: Automatically computes intrinsic value, NPV, and essential financial metrics.
- User-Friendly Interface: Comprehensive step-by-step instructions facilitate the entire process.
Who Should Use This Product?
- Individual Investors: Make informed decisions about buying or selling Home Bancorp, Inc. (HBCP) stock.
- Financial Analysts: Enhance valuation processes with ready-to-use financial models specific to Home Bancorp, Inc. (HBCP).
- Consultants: Provide professional valuation insights on Home Bancorp, Inc. (HBCP) to clients efficiently and accurately.
- Business Owners: Gain insights into how regional banks like Home Bancorp, Inc. (HBCP) are valued to inform your own business strategy.
- Finance Students: Explore valuation techniques using real-world data and scenarios related to Home Bancorp, Inc. (HBCP).
What the Template Contains
- Pre-Filled DCF Model: Home Bancorp, Inc.'s (HBCP) financial data preloaded for immediate use.
- WACC Calculator: Detailed calculations for Weighted Average Cost of Capital.
- Financial Ratios: Evaluate Home Bancorp, Inc.'s (HBCP) profitability, leverage, and efficiency.
- Editable Inputs: Change assumptions such as growth, margins, and CAPEX to fit your scenarios.
- Financial Statements: Annual and quarterly reports to support detailed analysis.
- Interactive Dashboard: Easily visualize key valuation metrics and results.
Disclaimer
All information, articles, and product details provided on this website are for general informational and educational purposes only. We do not claim any ownership over, nor do we intend to infringe upon, any trademarks, copyrights, logos, brand names, or other intellectual property mentioned or depicted on this site. Such intellectual property remains the property of its respective owners, and any references here are made solely for identification or informational purposes, without implying any affiliation, endorsement, or partnership.
We make no representations or warranties, express or implied, regarding the accuracy, completeness, or suitability of any content or products presented. Nothing on this website should be construed as legal, tax, investment, financial, medical, or other professional advice. In addition, no part of this site—including articles or product references—constitutes a solicitation, recommendation, endorsement, advertisement, or offer to buy or sell any securities, franchises, or other financial instruments, particularly in jurisdictions where such activity would be unlawful.
All content is of a general nature and may not address the specific circumstances of any individual or entity. It is not a substitute for professional advice or services. Any actions you take based on the information provided here are strictly at your own risk. You accept full responsibility for any decisions or outcomes arising from your use of this website and agree to release us from any liability in connection with your use of, or reliance upon, the content or products found herein.