
|
Hilton Grand Vacations Inc. (HGV) DCF -Bewertung |
Fully Editable: Tailor To Your Needs In Excel Or Sheets
Professional Design: Trusted, Industry-Standard Templates
Investor-Approved Valuation Models
MAC/PC Compatible, Fully Unlocked
No Expertise Is Needed; Easy To Follow
Hilton Grand Vacations Inc. (HGV) Bundle
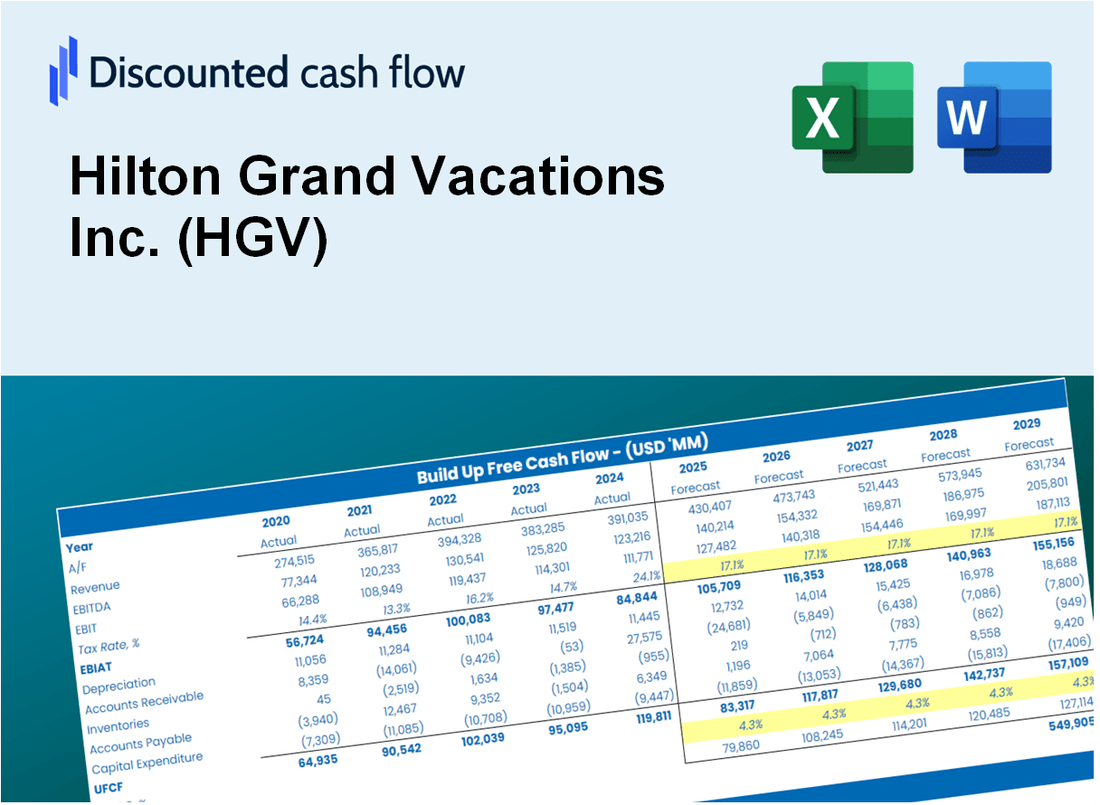
Bewerten Sie Hilton Grand Vacations Inc. (HGV) finanzielle Aussichten wie ein Experte! Dieser (HGV) DCF-Taschenrechner bietet Ihnen voraberbezogene Finanzdaten und die Flexibilität, das Umsatzwachstum, WACC, Margen und andere wesentliche Annahmen zu ändern, um sich an Ihren Projektionen anzupassen.
What You Will Get
- Editable Excel Template: A fully customizable Excel-based DCF Calculator featuring pre-filled real HGV financials.
- Real-World Data: Historical data and forward-looking estimates (as indicated in the yellow cells).
- Forecast Flexibility: Adjust forecast assumptions such as revenue growth, EBITDA %, and WACC.
- Automatic Calculations: Instantly observe the effect of your inputs on Hilton Grand Vacations' valuation.
- Professional Tool: Designed for investors, CFOs, consultants, and financial analysts.
- User-Friendly Design: Organized for clarity and ease of use, complete with step-by-step instructions.
Key Features
- Comprehensive Data: Hilton Grand Vacations Inc.’s (HGV) historical financial statements and pre-filled projections.
- Customizable Parameters: Adjust WACC, tax rates, revenue growth, and EBITDA margins to fit your analysis.
- Real-Time Insights: Watch Hilton’s (HGV) intrinsic value update instantly as you modify inputs.
- Intuitive Visuals: Dashboard graphs illustrate valuation outcomes and essential metrics clearly.
- Designed for Precision: A specialized tool tailored for analysts, investors, and finance professionals.
How It Works
- Step 1: Download the Excel file.
- Step 2: Review pre-entered Hilton Grand Vacations Inc. (HGV) data (historical and projected).
- Step 3: Adjust key assumptions (yellow cells) based on your analysis.
- Step 4: View automatic recalculations for Hilton Grand Vacations Inc. (HGV)’s intrinsic value.
- Step 5: Use the outputs for investment decisions or reporting.
Why Choose This Calculator for Hilton Grand Vacations Inc. (HGV)?
- Comprehensive Tool: Offers DCF, WACC, and financial ratio analyses all in one convenient package.
- Customizable Inputs: Modify yellow-highlighted cells to explore different financial scenarios.
- Detailed Insights: Automatically computes the intrinsic value and Net Present Value for Hilton Grand Vacations Inc. (HGV).
- Preloaded Data: Access to historical and forecasted data for reliable starting points.
- Professional Quality: Perfect for financial analysts, investors, and business consultants focused on Hilton Grand Vacations Inc. (HGV).
Who Should Use This Product?
- Individual Vacationers: Make informed decisions about purchasing or investing in Hilton Grand Vacations (HGV) offerings.
- Travel Advisors: Enhance client recommendations with comprehensive insights into HGV's vacation options.
- Real Estate Investors: Analyze the vacation ownership market and leverage HGV's data for investment strategies.
- Hospitality Professionals: Gain a deeper understanding of the vacation ownership industry through HGV's business model.
- Tourism Students: Explore the dynamics of vacation ownership and hospitality management with real-world case studies from HGV.
What the Template Contains
- Comprehensive DCF Model: Editable template featuring in-depth valuation calculations.
- Real-World Data: Hilton Grand Vacations Inc. (HGV)’s historical and projected financials preloaded for analysis.
- Customizable Parameters: Modify WACC, growth rates, and tax assumptions to explore various scenarios.
- Financial Statements: Complete annual and quarterly breakdowns for enhanced insights.
- Key Ratios: Integrated analysis covering profitability, efficiency, and leverage metrics.
- Dashboard with Visual Outputs: Charts and tables designed for clear, actionable results.
Disclaimer
All information, articles, and product details provided on this website are for general informational and educational purposes only. We do not claim any ownership over, nor do we intend to infringe upon, any trademarks, copyrights, logos, brand names, or other intellectual property mentioned or depicted on this site. Such intellectual property remains the property of its respective owners, and any references here are made solely for identification or informational purposes, without implying any affiliation, endorsement, or partnership.
We make no representations or warranties, express or implied, regarding the accuracy, completeness, or suitability of any content or products presented. Nothing on this website should be construed as legal, tax, investment, financial, medical, or other professional advice. In addition, no part of this site—including articles or product references—constitutes a solicitation, recommendation, endorsement, advertisement, or offer to buy or sell any securities, franchises, or other financial instruments, particularly in jurisdictions where such activity would be unlawful.
All content is of a general nature and may not address the specific circumstances of any individual or entity. It is not a substitute for professional advice or services. Any actions you take based on the information provided here are strictly at your own risk. You accept full responsibility for any decisions or outcomes arising from your use of this website and agree to release us from any liability in connection with your use of, or reliance upon, the content or products found herein.