
|
Hillman Solutions Corp. (HLMN) DCF -Bewertung |
Fully Editable: Tailor To Your Needs In Excel Or Sheets
Professional Design: Trusted, Industry-Standard Templates
Investor-Approved Valuation Models
MAC/PC Compatible, Fully Unlocked
No Expertise Is Needed; Easy To Follow
Hillman Solutions Corp. (HLMN) Bundle
Bewerten Sie die finanziellen Aussichten von Hillman Solutions Corp. (HLMN) wie ein Experte! Dieser (HLMN) DCF-Taschenrechner bietet Ihnen vorgefüllte Finanzdaten und die Freiheit, das Umsatzwachstum, WACC, Margen und andere wesentliche Annahmen zu ändern, um sich an Ihren Vorhersagen zu übereinstimmen.
What You Will Get
- Editable Forecast Inputs: Easily modify assumptions (growth %, margins, WACC) to explore various scenarios.
- Real-World Data: Hillman Solutions Corp. (HLMN) financial data pre-filled to kickstart your analysis.
- Automatic DCF Outputs: The template computes Net Present Value (NPV) and intrinsic value automatically.
- Customizable and Professional: A refined Excel model that adjusts to your valuation requirements.
- Built for Analysts and Investors: Perfect for evaluating projections, confirming strategies, and enhancing efficiency.
Key Features
- Customizable Financial Inputs: Adjust essential parameters such as revenue growth, operating margin, and capital investments.
- Instant DCF Valuation: Quickly computes intrinsic value, NPV, and other financial metrics.
- High-Precision Estimates: Leverages Hillman Solutions Corp.'s (HLMN) actual financial data for accurate valuation results.
- Effortless Scenario Testing: Easily explore various assumptions and analyze different outcomes.
- Efficiency Booster: Streamline the valuation process without the hassle of creating intricate models from the ground up.
How It Works
- Download the Template: Gain immediate access to the Excel-based HLMN DCF Calculator.
- Input Your Assumptions: Modify the yellow-highlighted cells for growth rates, WACC, margins, and more.
- Instant Calculations: The model automatically recalculates Hillman Solutions Corp.'s intrinsic value.
- Test Scenarios: Experiment with different assumptions to assess potential valuation shifts.
- Analyze and Decide: Utilize the outcomes to inform your investment or financial analysis.
Why Choose Hillman Solutions Corp. (HLMN)?
- Streamline Your Processes: Our solutions are designed to enhance efficiency without the need for extensive setup.
- Enhance Accuracy: Dependable data and methodologies minimize the risk of errors in your operations.
- Completely Customizable: Adapt our offerings to align with your unique business needs and forecasts.
- User-Friendly Interface: Intuitive designs and outputs simplify data interpretation and decision-making.
- Endorsed by Industry Leaders: Crafted for professionals who prioritize accuracy and ease of use.
Who Should Use Hillman Solutions Corp. (HLMN)?
- Investors: Evaluate Hillman Solutions' market position before making investment decisions.
- CFOs and Financial Analysts: Enhance valuation methodologies and validate financial forecasts.
- Startup Founders: Discover valuation strategies employed by established companies like Hillman Solutions.
- Consultants: Create detailed valuation reports to assist clients in their financial planning.
- Students and Educators: Utilize practical data for learning and teaching valuation principles.
What the Template Contains
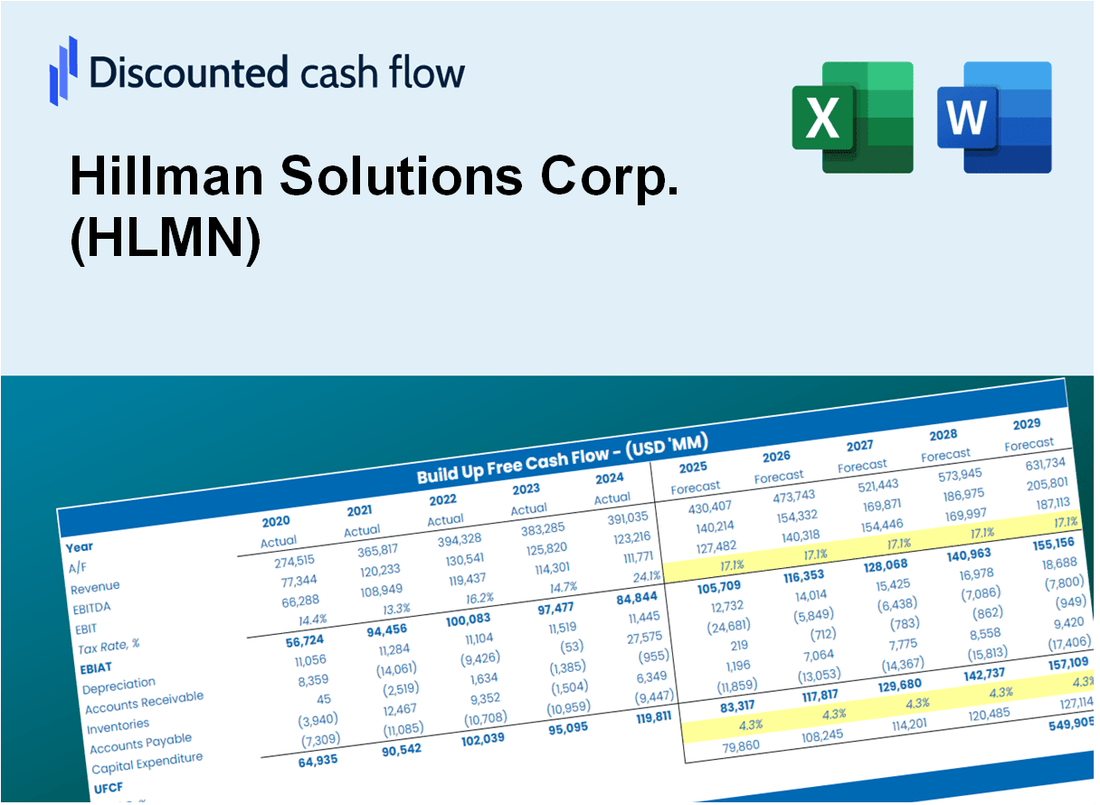
- Operating and Balance Sheet Data: Pre-filled Hillman Solutions Corp. (HLMN) historical data and forecasts, including revenue, EBITDA, EBIT, and capital expenditures.
- WACC Calculation: A dedicated sheet for Weighted Average Cost of Capital (WACC), including parameters like Beta, risk-free rate, and share price.
- DCF Valuation (Unlevered and Levered): Editable Discounted Cash Flow models showing intrinsic value with detailed calculations.
- Financial Statements: Pre-loaded financial statements (annual and quarterly) to support analysis.
- Key Ratios: Includes profitability, leverage, and efficiency ratios for Hillman Solutions Corp. (HLMN).
- Dashboard and Charts: Visual summary of valuation outputs and assumptions to analyze results easily.
Disclaimer
All information, articles, and product details provided on this website are for general informational and educational purposes only. We do not claim any ownership over, nor do we intend to infringe upon, any trademarks, copyrights, logos, brand names, or other intellectual property mentioned or depicted on this site. Such intellectual property remains the property of its respective owners, and any references here are made solely for identification or informational purposes, without implying any affiliation, endorsement, or partnership.
We make no representations or warranties, express or implied, regarding the accuracy, completeness, or suitability of any content or products presented. Nothing on this website should be construed as legal, tax, investment, financial, medical, or other professional advice. In addition, no part of this site—including articles or product references—constitutes a solicitation, recommendation, endorsement, advertisement, or offer to buy or sell any securities, franchises, or other financial instruments, particularly in jurisdictions where such activity would be unlawful.
All content is of a general nature and may not address the specific circumstances of any individual or entity. It is not a substitute for professional advice or services. Any actions you take based on the information provided here are strictly at your own risk. You accept full responsibility for any decisions or outcomes arising from your use of this website and agree to release us from any liability in connection with your use of, or reliance upon, the content or products found herein.