
|
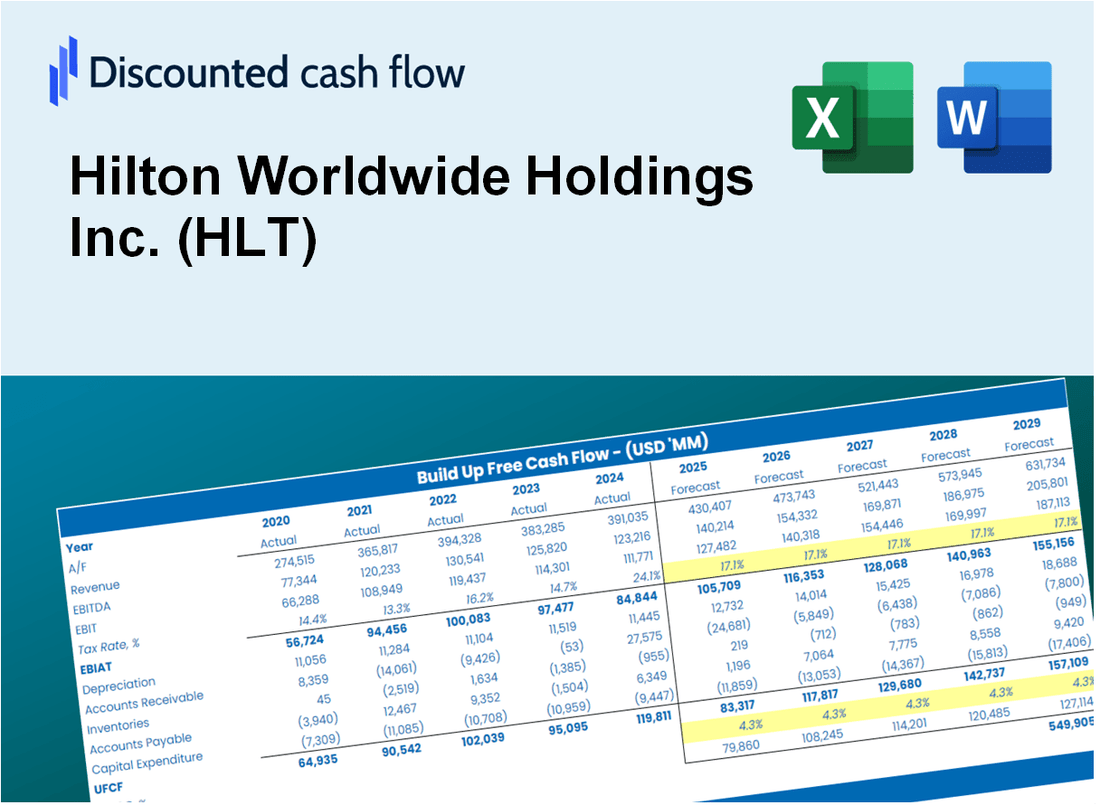
Hilton Worldwide Holdings Inc. (HLT) DCF -Bewertung |
Fully Editable: Tailor To Your Needs In Excel Or Sheets
Professional Design: Trusted, Industry-Standard Templates
Investor-Approved Valuation Models
MAC/PC Compatible, Fully Unlocked
No Expertise Is Needed; Easy To Follow
Hilton Worldwide Holdings Inc. (HLT) Bundle
Entdecken Sie das wahre Potenzial von Hilton Worldwide Holdings Inc. (HLT) mit unserem fortschrittlichen DCF -Taschenrechner! Passen Sie die wichtigsten Annahmen an, erkunden Sie verschiedene Szenarien und untersuchen, wie unterschiedliche Änderungen die Bewertung von Hilton Worldwide Holdings Inc. (HLT) beeinflussen - alles innerhalb einer einzelnen Excel -Vorlage.
What You Will Get
- Editable Forecast Inputs: Easily modify assumptions (growth %, margins, WACC) to create various scenarios tailored to Hilton Worldwide Holdings Inc. (HLT).
- Real-World Data: Hilton’s financial data pre-filled to kickstart your analysis.
- Automatic DCF Outputs: The template computes Net Present Value (NPV) and intrinsic value for you effortlessly.
- Customizable and Professional: A refined Excel model that adjusts to your valuation requirements for Hilton Worldwide Holdings Inc. (HLT).
- Built for Analysts and Investors: Perfect for evaluating projections, validating strategies, and optimizing your time.
Key Features
- Customizable Revenue Metrics: Adjust essential inputs such as occupancy rates, average daily rates, and operating expenses.
- Instant DCF Valuation: Quickly calculates intrinsic value, net present value, and other financial metrics.
- High-Precision Accuracy: Utilizes Hilton’s actual financial data for dependable valuation results.
- Streamlined Scenario Analysis: Easily evaluate various assumptions and analyze different outcomes.
- Efficiency Booster: Avoid the hassle of constructing intricate valuation models from the ground up.
How It Works
- Step 1: Download the Excel file.
- Step 2: Review Hilton’s pre-filled financial data and forecasts.
- Step 3: Modify key inputs such as occupancy rates, average daily rate (ADR), and operating expenses (highlighted cells).
- Step 4: Observe the DCF model update in real-time as you adjust your assumptions.
- Step 5: Evaluate the outputs and leverage the results for your investment decisions.
Why Choose This Calculator for Hilton Worldwide Holdings Inc. (HLT)?
- User-Friendly Interface: Tailored for both novices and seasoned users.
- Customizable Parameters: Adjust inputs effortlessly to align with your financial assessments.
- Real-Time Feedback: Observe immediate updates to Hilton’s valuation as you modify inputs.
- Preloaded Data: Comes with Hilton’s actual financial metrics for swift evaluations.
- Preferred by Experts: Utilized by investors and analysts for strategic decision-making.
Who Should Use This Product?
- Investors: Evaluate Hilton's valuation before making stock transactions.
- CFOs and Financial Analysts: Optimize valuation methodologies and assess financial forecasts.
- Hotel Operators and Founders: Understand how leading hospitality companies like Hilton are valued.
- Consultants: Provide comprehensive valuation reports for clients in the hospitality sector.
- Students and Educators: Utilize real-world data to teach and practice valuation strategies.
What the Template Contains
- Pre-Filled DCF Model: Hilton’s financial data preloaded for immediate use.
- WACC Calculator: Detailed calculations for Weighted Average Cost of Capital.
- Financial Ratios: Evaluate Hilton’s profitability, leverage, and efficiency.
- Editable Inputs: Change assumptions such as growth, margins, and CAPEX to fit your scenarios.
- Financial Statements: Annual and quarterly reports to support detailed analysis.
- Interactive Dashboard: Easily visualize key valuation metrics and results.
Disclaimer
All information, articles, and product details provided on this website are for general informational and educational purposes only. We do not claim any ownership over, nor do we intend to infringe upon, any trademarks, copyrights, logos, brand names, or other intellectual property mentioned or depicted on this site. Such intellectual property remains the property of its respective owners, and any references here are made solely for identification or informational purposes, without implying any affiliation, endorsement, or partnership.
We make no representations or warranties, express or implied, regarding the accuracy, completeness, or suitability of any content or products presented. Nothing on this website should be construed as legal, tax, investment, financial, medical, or other professional advice. In addition, no part of this site—including articles or product references—constitutes a solicitation, recommendation, endorsement, advertisement, or offer to buy or sell any securities, franchises, or other financial instruments, particularly in jurisdictions where such activity would be unlawful.
All content is of a general nature and may not address the specific circumstances of any individual or entity. It is not a substitute for professional advice or services. Any actions you take based on the information provided here are strictly at your own risk. You accept full responsibility for any decisions or outcomes arising from your use of this website and agree to release us from any liability in connection with your use of, or reliance upon, the content or products found herein.