
|
Honasa Consumer Limited (Honasa.NS) DCF -Bewertung |
Fully Editable: Tailor To Your Needs In Excel Or Sheets
Professional Design: Trusted, Industry-Standard Templates
Investor-Approved Valuation Models
MAC/PC Compatible, Fully Unlocked
No Expertise Is Needed; Easy To Follow
Honasa Consumer Limited (HONASA.NS) Bundle
Verbessern Sie Ihre Anlagestrategien mit dem DCF -Taschenrechner von Honasa Consumer Limited (Honasans)! Erforschen Sie authentische Finanzdaten, passen Sie Wachstumsprojektionen und -kosten an und beachten Sie, wie sich diese Modifikationen in Echtzeit auf den inneren Wert von Honasa Consumer Limited (Honasans) auswirken.
What You Will Receive
- Adjustable Forecast Variables: Effortlessly modify assumptions (growth %, margins, WACC) to develop a range of scenarios.
- Real-Time Financial Data: Pre-filled financial information for Honasa Consumer Limited (HONASANS) to kickstart your analysis.
- Automated DCF Calculations: The template automatically computes Net Present Value (NPV) and intrinsic value for you.
- Tailored and Professional Design: A sleek Excel model that conforms to your valuation requirements.
- Designed for Analysts and Investors: Perfect for evaluating projections, validating strategies, and enhancing efficiency.
Key Features
- Real-Life HONASANS Data: Pre-loaded with Honasa Consumer Limited’s historical financials and anticipated projections.
- Fully Customizable Inputs: Modify revenue growth, profit margins, WACC, tax rates, and capital investments to suit your analysis.
- Dynamic Valuation Model: Automatically recalculates Net Present Value (NPV) and intrinsic value based on your input adjustments.
- Scenario Testing: Develop multiple forecasting scenarios to explore various valuation outcomes.
- User-Friendly Design: Intuitive and organized, making it accessible for both professionals and novices.
How It Works
- Step 1: Download the Excel file for Honasa Consumer Limited (HONASANS).
- Step 2: Examine the pre-filled financial data and projections for Honasa Consumer Limited (HONASANS).
- Step 3: Adjust key inputs such as revenue growth, WACC, and tax rates (highlighted cells) for Honasa Consumer Limited (HONASANS).
- Step 4: View the DCF model update in real-time as you modify your assumptions for Honasa Consumer Limited (HONASANS).
- Step 5: Evaluate the outputs and leverage the results for your investment decisions regarding Honasa Consumer Limited (HONASANS).
Why Choose This Calculator for Honasa Consumer Limited (HONASANS)?
- User-Friendly Design: Perfect for both novices and seasoned professionals.
- Customizable Inputs: Easily adjust parameters to suit your analytical needs.
- Real-Time Feedback: Watch instant updates on Honasa’s valuation as you tweak the inputs.
- Pre-Loaded Data: Comes equipped with Honasa’s latest financial information for swift evaluations.
- Backed by Experts: Favored by investors and analysts for strategic decision-making.
Who Can Benefit from Honasa Consumer Limited (HONASANS)?
- Finance Students: Master valuation methodologies and apply them using authentic market data.
- Academics: Integrate industry-standard models into your curriculum or research initiatives.
- Investors: Validate your own hypotheses and evaluate valuation projections for Honasa Consumer Limited (HONASANS).
- Analysts: Enhance your efficiency with a customizable DCF model designed for ease of use.
- Small Business Owners: Understand the analytical processes used for assessing large public enterprises like Honasa Consumer Limited (HONASANS).
What the Template Contains
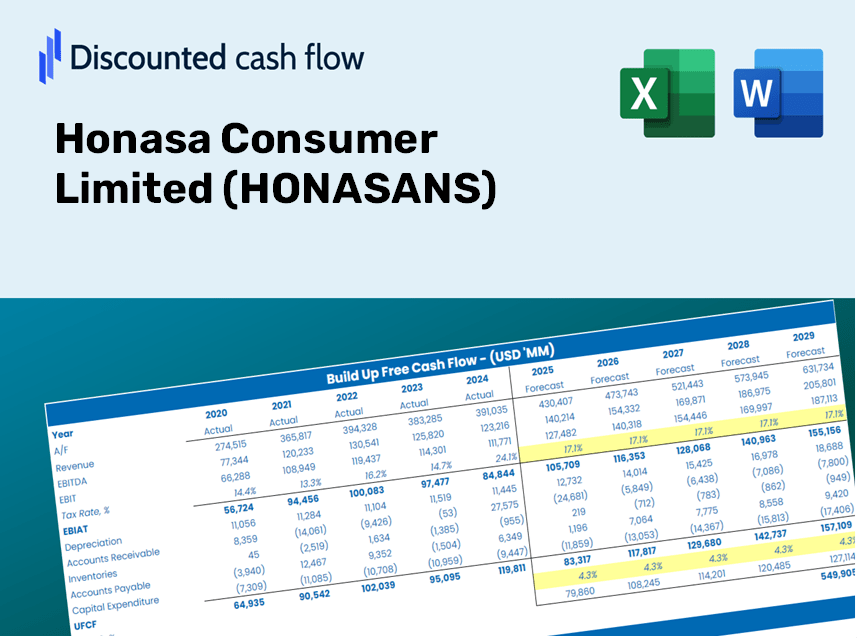
- Historical Data: Contains past financial information and baseline forecasts for Honasa Consumer Limited (HONASANS).
- DCF and Levered DCF Models: Comprehensive templates designed to determine the intrinsic value of Honasa Consumer Limited (HONASANS).
- WACC Sheet: Pre-built calculations for the Weighted Average Cost of Capital specific to Honasa Consumer Limited (HONASANS).
- Editable Inputs: Customize key drivers such as growth rates, EBITDA percentages, and CAPEX assumptions for Honasa Consumer Limited (HONASANS).
- Quarterly and Annual Statements: A thorough analysis of Honasa Consumer Limited’s (HONASANS) financial performance.
- Interactive Dashboard: Dynamically visualize valuation results and forecasts for Honasa Consumer Limited (HONASANS).
Disclaimer
All information, articles, and product details provided on this website are for general informational and educational purposes only. We do not claim any ownership over, nor do we intend to infringe upon, any trademarks, copyrights, logos, brand names, or other intellectual property mentioned or depicted on this site. Such intellectual property remains the property of its respective owners, and any references here are made solely for identification or informational purposes, without implying any affiliation, endorsement, or partnership.
We make no representations or warranties, express or implied, regarding the accuracy, completeness, or suitability of any content or products presented. Nothing on this website should be construed as legal, tax, investment, financial, medical, or other professional advice. In addition, no part of this site—including articles or product references—constitutes a solicitation, recommendation, endorsement, advertisement, or offer to buy or sell any securities, franchises, or other financial instruments, particularly in jurisdictions where such activity would be unlawful.
All content is of a general nature and may not address the specific circumstances of any individual or entity. It is not a substitute for professional advice or services. Any actions you take based on the information provided here are strictly at your own risk. You accept full responsibility for any decisions or outcomes arising from your use of this website and agree to release us from any liability in connection with your use of, or reliance upon, the content or products found herein.