
|
Hudson Pacific Properties, Inc. (HPP) DCF -Bewertung |
Fully Editable: Tailor To Your Needs In Excel Or Sheets
Professional Design: Trusted, Industry-Standard Templates
Investor-Approved Valuation Models
MAC/PC Compatible, Fully Unlocked
No Expertise Is Needed; Easy To Follow
Hudson Pacific Properties, Inc. (HPP) Bundle
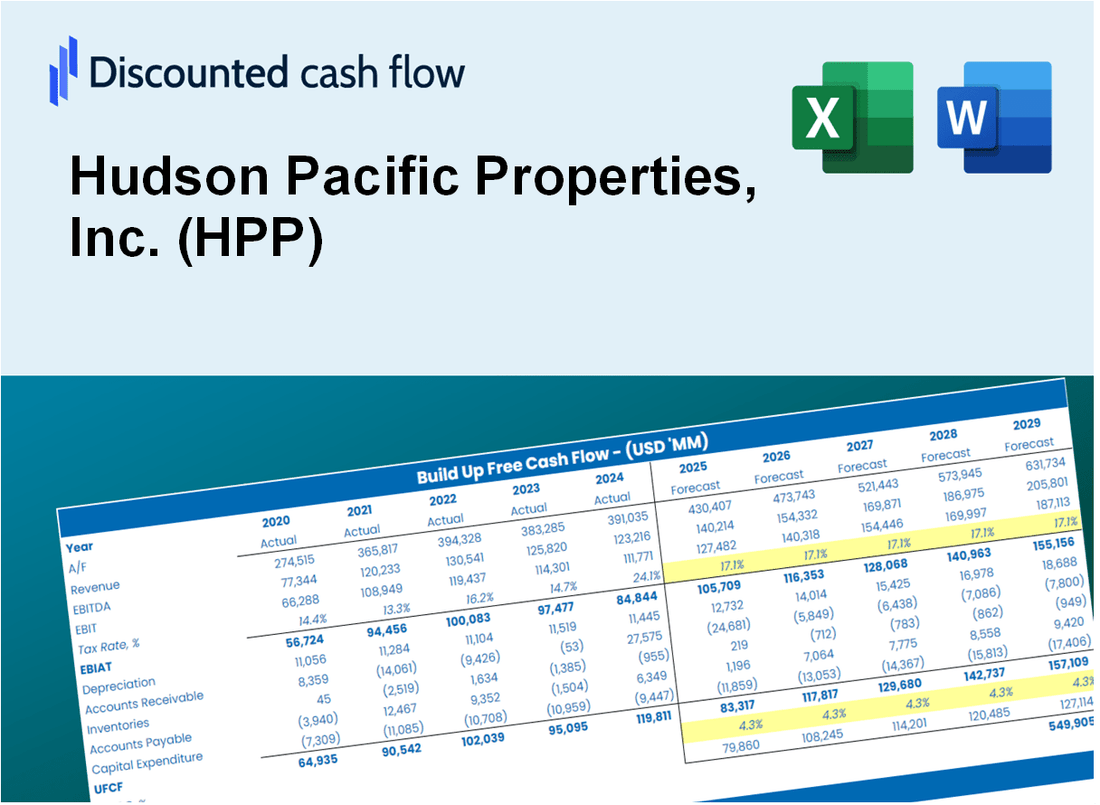
Bewerten Sie die finanziellen Aussichten von Hudson Pacific Properties, Inc. (HPP) wie ein Experte! Dieser (HPP) DCF-Taschenrechner verfügt über vorgefüllte Finanzdaten und bietet vollständige Flexibilität, um das Umsatzwachstum, WACC, Margen und andere kritische Annahmen zu ändern, um sich an Ihren Projektionen auszurichten.
What You Will Receive
- Authentic Hudson Pacific Data: Preloaded financial metrics – from revenue to EBIT – based on real and forecasted figures.
- Complete Customization: Modify all essential parameters (yellow cells) such as WACC, growth %, and tax rates.
- Real-Time Valuation Updates: Automatic recalculations to evaluate the effects of changes on Hudson Pacific's fair value.
- Flexible Excel Template: Designed for quick modifications, scenario analysis, and comprehensive projections.
- Efficient and Precise: Avoid the hassle of building models from the ground up while ensuring accuracy and adaptability.
Key Features
- Comprehensive DCF Model: Offers both unlevered and levered DCF valuation frameworks tailored for Hudson Pacific Properties, Inc. (HPP).
- WACC Analysis Tool: Features a pre-designed Weighted Average Cost of Capital sheet with adjustable parameters.
- Customizable Forecast Inputs: Adjust growth projections, capital expenditures, and discount rates as needed.
- Integrated Financial Ratios: Evaluate profitability, leverage, and efficiency ratios specific to Hudson Pacific Properties, Inc. (HPP).
- Visual Dashboard and Charts: Graphical representations provide a clear overview of essential valuation metrics for straightforward analysis.
How It Works
- Step 1: Download the Excel file.
- Step 2: Review pre-entered Hudson Pacific Properties, Inc. (HPP) data (historical and projected).
- Step 3: Adjust key assumptions (yellow cells) based on your analysis.
- Step 4: View automatic recalculations for Hudson Pacific Properties, Inc. (HPP)'s intrinsic value.
- Step 5: Use the outputs for investment decisions or reporting.
Why Choose This Calculator for Hudson Pacific Properties, Inc. (HPP)?
- User-Friendly Interface: Tailored for both novice and seasoned users.
- Customizable Inputs: Adjust parameters to suit your specific analysis needs.
- Real-Time Valuation: Monitor immediate updates to Hudson Pacific's valuation as you change inputs.
- Pre-Loaded Data: Comes with Hudson Pacific's latest financial information for swift evaluations.
- Preferred by Experts: Valued by investors and analysts for making strategic decisions.
Who Should Use This Product?
- Investors: Accurately assess Hudson Pacific Properties, Inc.'s (HPP) fair value before making investment choices.
- CFOs: Utilize a professional-grade DCF model for financial reporting and analysis specific to HPP.
- Consultants: Easily customize the template for valuation reports tailored to HPP clients.
- Entrepreneurs: Gain insights into financial modeling practices employed by leading real estate firms like HPP.
- Educators: Implement it as a teaching resource to illustrate valuation techniques relevant to HPP.
What the Template Contains
- Comprehensive DCF Model: Editable template with detailed valuation calculations for Hudson Pacific Properties, Inc. (HPP).
- Real-World Data: Hudson Pacific Properties’ historical and projected financials preloaded for analysis.
- Customizable Parameters: Adjust WACC, growth rates, and tax assumptions to test various scenarios.
- Financial Statements: Complete annual and quarterly breakdowns for deeper insights into HPP's performance.
- Key Ratios: Built-in analysis for profitability, efficiency, and leverage relevant to Hudson Pacific Properties.
- Dashboard with Visual Outputs: Charts and tables providing clear, actionable results for HPP stakeholders.
Disclaimer
All information, articles, and product details provided on this website are for general informational and educational purposes only. We do not claim any ownership over, nor do we intend to infringe upon, any trademarks, copyrights, logos, brand names, or other intellectual property mentioned or depicted on this site. Such intellectual property remains the property of its respective owners, and any references here are made solely for identification or informational purposes, without implying any affiliation, endorsement, or partnership.
We make no representations or warranties, express or implied, regarding the accuracy, completeness, or suitability of any content or products presented. Nothing on this website should be construed as legal, tax, investment, financial, medical, or other professional advice. In addition, no part of this site—including articles or product references—constitutes a solicitation, recommendation, endorsement, advertisement, or offer to buy or sell any securities, franchises, or other financial instruments, particularly in jurisdictions where such activity would be unlawful.
All content is of a general nature and may not address the specific circumstances of any individual or entity. It is not a substitute for professional advice or services. Any actions you take based on the information provided here are strictly at your own risk. You accept full responsibility for any decisions or outcomes arising from your use of this website and agree to release us from any liability in connection with your use of, or reliance upon, the content or products found herein.