
|
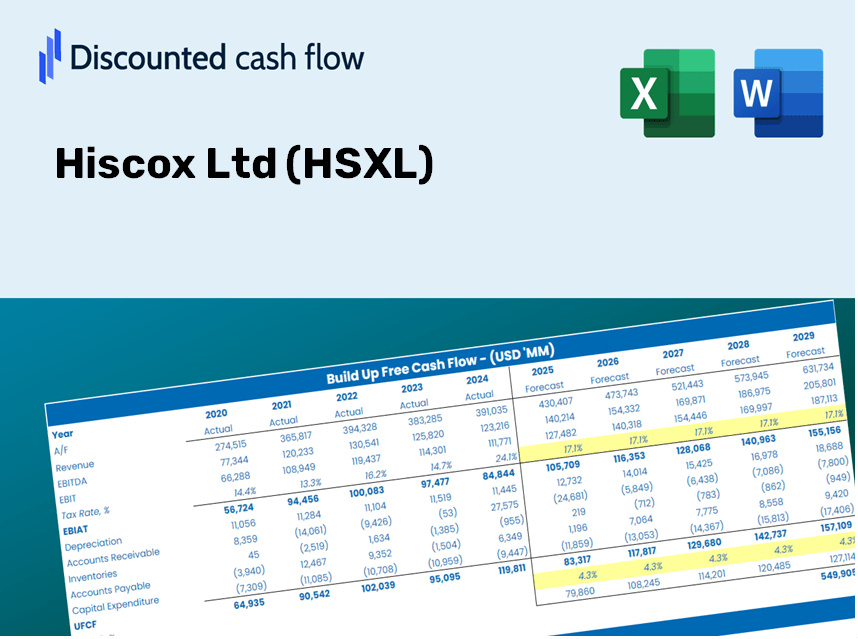
Hiscox Ltd (Hsx.l) DCF -Bewertung |
Fully Editable: Tailor To Your Needs In Excel Or Sheets
Professional Design: Trusted, Industry-Standard Templates
Investor-Approved Valuation Models
MAC/PC Compatible, Fully Unlocked
No Expertise Is Needed; Easy To Follow
Hiscox Ltd (HSX.L) Bundle
Möchten Sie den inneren Wert von Hiscox Ltd bewerten? Unser (HSXL) DCF-Taschenrechner integriert reale Daten mit umfassenden Anpassungsfunktionen, sodass Sie Ihre Prognosen verfeinern und fundiertere Investitionsentscheidungen treffen können.
Discounted Cash Flow (DCF) - (USD MM)
| Year | AY1 2020 |
AY2 2021 |
AY3 2022 |
AY4 2023 |
AY5 2024 |
FY1 2025 |
FY2 2026 |
FY3 2027 |
FY4 2028 |
FY5 2029 |
|---|---|---|---|---|---|---|---|---|---|---|
| Revenue | 2,472.7 | 2,501.1 | 2,263.3 | 2,814.5 | 2,897.2 | 3,034.4 | 3,178.0 | 3,328.5 | 3,486.1 | 3,651.1 |
| Revenue Growth, % | 0 | 1.15 | -9.51 | 24.35 | 2.94 | 4.73 | 4.73 | 4.73 | 4.73 | 4.73 |
| EBITDA | -127.6 | 188.8 | 255.3 | 555.3 | 608.0 | 330.1 | 345.7 | 362.1 | 379.2 | 397.1 |
| EBITDA, % | -5.16 | 7.55 | 11.28 | 19.73 | 20.99 | 10.88 | 10.88 | 10.88 | 10.88 | 10.88 |
| Depreciation | 43.2 | 44.4 | 45.6 | 58.7 | 46.2 | 55.9 | 58.6 | 61.3 | 64.3 | 67.3 |
| Depreciation, % | 1.75 | 1.77 | 2.02 | 2.08 | 1.59 | 1.84 | 1.84 | 1.84 | 1.84 | 1.84 |
| EBIT | -170.8 | 144.5 | 209.7 | 496.7 | 561.8 | 274.1 | 287.1 | 300.7 | 314.9 | 329.9 |
| EBIT, % | -6.91 | 5.78 | 9.26 | 17.65 | 19.39 | 9.03 | 9.03 | 9.03 | 9.03 | 9.03 |
| Total Cash | 1,247.9 | 1,028.2 | 1,062.2 | 1,120.1 | 933.4 | 1,277.6 | 1,338.1 | 1,401.5 | 1,467.8 | 1,537.3 |
| Total Cash, percent | .0 | .0 | .0 | .0 | .0 | .0 | .0 | .0 | .0 | .0 |
| Account Receivables | .0 | .0 | .0 | .0 | 189.4 | 39.7 | 41.6 | 43.5 | 45.6 | 47.7 |
| Account Receivables, % | 0 | 0 | 0 | 0 | 6.54 | 1.31 | 1.31 | 1.31 | 1.31 | 1.31 |
| Inventories | .0 | .0 | .0 | .0 | .0 | .0 | .0 | .0 | .0 | .0 |
| Inventories, % | 0 | 0 | 0 | 0 | 0 | 0 | 0 | 0 | 0 | 0 |
| Accounts Payable | 794.1 | 213.8 | .0 | .0 | .0 | 246.8 | 258.5 | 270.7 | 283.5 | 296.9 |
| Accounts Payable, % | 32.12 | 8.55 | 0 | 0 | 0 | 8.13 | 8.13 | 8.13 | 8.13 | 8.13 |
| Capital Expenditure | -54.4 | -44.8 | -15.9 | -33.2 | -29.7 | -41.9 | -43.9 | -45.9 | -48.1 | -50.4 |
| Capital Expenditure, % | -2.2 | -1.79 | -0.7025 | -1.18 | -1.03 | -1.38 | -1.38 | -1.38 | -1.38 | -1.38 |
| Tax Rate, % | 8.49 | 8.49 | 8.49 | 8.49 | 8.49 | 8.49 | 8.49 | 8.49 | 8.49 | 8.49 |
| EBITAT | -186.8 | 143.5 | 193.2 | 565.0 | 514.1 | 264.8 | 277.3 | 290.5 | 304.2 | 318.6 |
| Depreciation | ||||||||||
| Changes in Account Receivables | ||||||||||
| Changes in Inventories | ||||||||||
| Changes in Accounts Payable | ||||||||||
| Capital Expenditure | ||||||||||
| UFCF | 596.1 | -437.4 | 9.1 | 590.4 | 341.1 | 675.4 | 301.8 | 316.1 | 331.1 | 346.8 |
| WACC, % | 5.36 | 5.35 | 5.3 | 5.36 | 5.29 | 5.33 | 5.33 | 5.33 | 5.33 | 5.33 |
| PV UFCF | ||||||||||
| SUM PV UFCF | 1,720.2 | |||||||||
| Long Term Growth Rate, % | 2.00 | |||||||||
| Free cash flow (T + 1) | 354 | |||||||||
| Terminal Value | 10,616 | |||||||||
| Present Terminal Value | 8,188 | |||||||||
| Enterprise Value | 9,908 | |||||||||
| Net Debt | -368 | |||||||||
| Equity Value | 10,277 | |||||||||
| Diluted Shares Outstanding, MM | 354 | |||||||||
| Equity Value Per Share | 2,903.16 |
What You Will Receive
- Customizable Excel Template: An adaptable Excel-based DCF Calculator featuring pre-loaded financial data for Hiscox Ltd (HSXL).
- Actual Data: Access to historical figures and projected estimates (highlighted in the yellow cells).
- Flexible Forecasting: Easily modify forecast parameters such as revenue growth, EBITDA %, and WACC.
- Instant Calculations: Quickly see how your input choices affect the valuation of Hiscox Ltd (HSXL).
- Professional Resource: Designed for investors, CFOs, consultants, and financial analysts.
- Intuitive Layout: Organized for simplicity and user-friendliness, complete with step-by-step guidance.
Key Features
- 🔍 Real-Life HSXL Financials: Pre-filled historical and projected data for Hiscox Ltd.
- ✏️ Fully Customizable Inputs: Modify all essential parameters (yellow cells) such as WACC, growth %, and tax rates.
- 📊 Professional DCF Valuation: Integrated formulas calculate Hiscox's intrinsic value using the Discounted Cash Flow method.
- ⚡ Instant Results: Visualize Hiscox's valuation immediately after adjustments.
- Scenario Analysis: Evaluate and contrast outcomes for different financial assumptions side-by-side.
How It Works
- Step 1: Download the Excel file.
- Step 2: Review pre-filled Hiscox Ltd (HSXL) data (historical and projected).
- Step 3: Modify key assumptions (highlighted in yellow) based on your analysis.
- Step 4: Observe automatic recalculations for Hiscox Ltd (HSXL)’s intrinsic value.
- Step 5: Utilize the results for investment decisions or reporting.
Why Opt for This Calculator?
- Designed for Experts: A sophisticated tool utilized by analysts, CFOs, and consultants.
- Real-Time Data: Hiscox Ltd’s (HSXL) historical and projected financials are preloaded for precision.
- Scenario Analysis: Effortlessly simulate various forecasts and assumptions.
- Clear Results: Automatically computes intrinsic value, NPV, and essential metrics.
- User-Friendly: Comprehensive step-by-step instructions help you navigate the process.
Who Can Benefit from This Product?
- Finance Students: Master valuation techniques and apply them with actual data.
- Academics: Integrate industry-standard models into your courses or research projects.
- Investors: Evaluate your own assumptions and analyze valuation results for Hiscox Ltd (HSXL).
- Analysts: Enhance your efficiency with a customizable, pre-built DCF model.
- Small Business Owners: Discover approaches to analyzing large public firms like Hiscox Ltd (HSXL).
Contents of the Template
- Preloaded HSXL Data: Historical and projected financial information, including revenue, EBIT, and capital expenditures.
- DCF and WACC Models: Advanced worksheets for calculating intrinsic value and Weighted Average Cost of Capital.
- Editable Inputs: Yellow-highlighted cells to modify revenue growth, tax rates, and discount rates.
- Financial Statements: Detailed annual and quarterly financial reports for in-depth analysis.
- Key Ratios: Profitability, leverage, and efficiency ratios for performance assessment.
- Dashboard and Charts: Visual representations of valuation results and underlying assumptions.
Disclaimer
All information, articles, and product details provided on this website are for general informational and educational purposes only. We do not claim any ownership over, nor do we intend to infringe upon, any trademarks, copyrights, logos, brand names, or other intellectual property mentioned or depicted on this site. Such intellectual property remains the property of its respective owners, and any references here are made solely for identification or informational purposes, without implying any affiliation, endorsement, or partnership.
We make no representations or warranties, express or implied, regarding the accuracy, completeness, or suitability of any content or products presented. Nothing on this website should be construed as legal, tax, investment, financial, medical, or other professional advice. In addition, no part of this site—including articles or product references—constitutes a solicitation, recommendation, endorsement, advertisement, or offer to buy or sell any securities, franchises, or other financial instruments, particularly in jurisdictions where such activity would be unlawful.
All content is of a general nature and may not address the specific circumstances of any individual or entity. It is not a substitute for professional advice or services. Any actions you take based on the information provided here are strictly at your own risk. You accept full responsibility for any decisions or outcomes arising from your use of this website and agree to release us from any liability in connection with your use of, or reliance upon, the content or products found herein.