
|
Howmet Aerospace Inc. (HWM) DCF -Bewertung |
Fully Editable: Tailor To Your Needs In Excel Or Sheets
Professional Design: Trusted, Industry-Standard Templates
Investor-Approved Valuation Models
MAC/PC Compatible, Fully Unlocked
No Expertise Is Needed; Easy To Follow
Howmet Aerospace Inc. (HWM) Bundle
Vereinfachen Sie die Bewertung von Howmet Aerospace Inc. (HWM) mit diesem anpassbaren DCF -Taschenrechner! Mit Real Howmet Aerospace Inc. (HWM) Finanzdaten und einstellbaren Prognose -Inputs können Sie Szenarien testen und Howmet Aerospace Inc. (HWM) in Minuten aufdecken.
What You Will Get
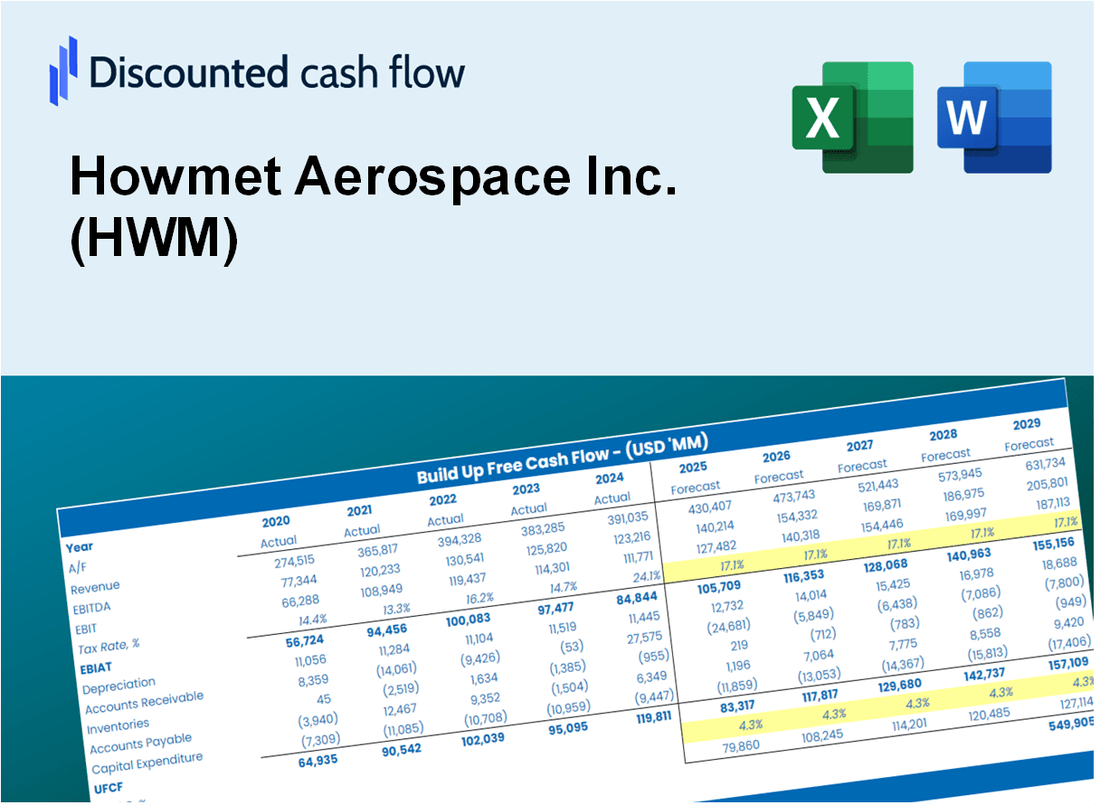
- Real Howmet Aerospace Data: Preloaded financials – from revenue to EBIT – based on actual and projected figures.
- Full Customization: Adjust all critical parameters (yellow cells) like WACC, growth %, and tax rates.
- Instant Valuation Updates: Automatic recalculations to analyze the impact of changes on Howmet Aerospace’s fair value.
- Versatile Excel Template: Tailored for quick edits, scenario testing, and detailed projections.
- Time-Saving and Accurate: Skip building models from scratch while maintaining precision and flexibility.
Key Features
- Real-Life HWM Data: Pre-filled with Howmet Aerospace's historical financials and future projections.
- Fully Customizable Inputs: Modify revenue growth, profit margins, WACC, tax rates, and capital expenditures.
- Dynamic Valuation Model: Automatic recalculations of Net Present Value (NPV) and intrinsic value based on your inputs.
- Scenario Testing: Develop multiple forecasting scenarios to explore various valuation outcomes.
- User-Friendly Design: Intuitive, organized, and suitable for both professionals and newcomers.
How It Works
- Step 1: Download the Excel file.
- Step 2: Review Howmet Aerospace Inc.'s pre-filled financial data and forecasts.
- Step 3: Modify critical inputs such as revenue growth, WACC, and tax rates (highlighted cells).
- Step 4: Watch the DCF model update instantly as you adjust assumptions.
- Step 5: Analyze the outputs and utilize the results for investment decisions.
Why Choose This Calculator for Howmet Aerospace Inc. (HWM)?
- Accuracy: Utilizes real Howmet Aerospace financials for precise data.
- Flexibility: Allows users to freely test and adjust inputs as needed.
- Time-Saving: Eliminates the need to create a DCF model from the ground up.
- Professional-Grade: Crafted with the precision and usability expected by CFOs.
- User-Friendly: Intuitive design makes it accessible for users without extensive financial modeling skills.
Who Should Use This Product?
- Professional Investors: Develop comprehensive and accurate valuation models for analyzing Howmet Aerospace Inc. (HWM) investments.
- Corporate Finance Teams: Evaluate valuation scenarios to inform strategic decisions within the organization.
- Consultants and Advisors: Deliver precise valuation insights to clients focused on Howmet Aerospace Inc. (HWM).
- Students and Educators: Utilize real-world data to enhance learning and practice in financial modeling.
- Aerospace Enthusiasts: Gain insights into how aerospace companies like Howmet Aerospace Inc. (HWM) are valued in the industry.
What the Howmet Aerospace Template Contains
- Preloaded HWM Data: Historical and projected financial data, including revenue, EBIT, and capital expenditures.
- DCF and WACC Models: Professional-grade sheets for calculating intrinsic value and Weighted Average Cost of Capital.
- Editable Inputs: Yellow-highlighted cells for adjusting revenue growth, tax rates, and discount rates.
- Financial Statements: Comprehensive annual and quarterly financials for deeper analysis.
- Key Ratios: Profitability, leverage, and efficiency ratios to evaluate performance.
- Dashboard and Charts: Visual summaries of valuation outcomes and assumptions.
Disclaimer
All information, articles, and product details provided on this website are for general informational and educational purposes only. We do not claim any ownership over, nor do we intend to infringe upon, any trademarks, copyrights, logos, brand names, or other intellectual property mentioned or depicted on this site. Such intellectual property remains the property of its respective owners, and any references here are made solely for identification or informational purposes, without implying any affiliation, endorsement, or partnership.
We make no representations or warranties, express or implied, regarding the accuracy, completeness, or suitability of any content or products presented. Nothing on this website should be construed as legal, tax, investment, financial, medical, or other professional advice. In addition, no part of this site—including articles or product references—constitutes a solicitation, recommendation, endorsement, advertisement, or offer to buy or sell any securities, franchises, or other financial instruments, particularly in jurisdictions where such activity would be unlawful.
All content is of a general nature and may not address the specific circumstances of any individual or entity. It is not a substitute for professional advice or services. Any actions you take based on the information provided here are strictly at your own risk. You accept full responsibility for any decisions or outcomes arising from your use of this website and agree to release us from any liability in connection with your use of, or reliance upon, the content or products found herein.