
|
Integra Lifesciences Holdings Corporation (IART) DCF -Bewertung |
Fully Editable: Tailor To Your Needs In Excel Or Sheets
Professional Design: Trusted, Industry-Standard Templates
Investor-Approved Valuation Models
MAC/PC Compatible, Fully Unlocked
No Expertise Is Needed; Easy To Follow
Integra LifeSciences Holdings Corporation (IART) Bundle
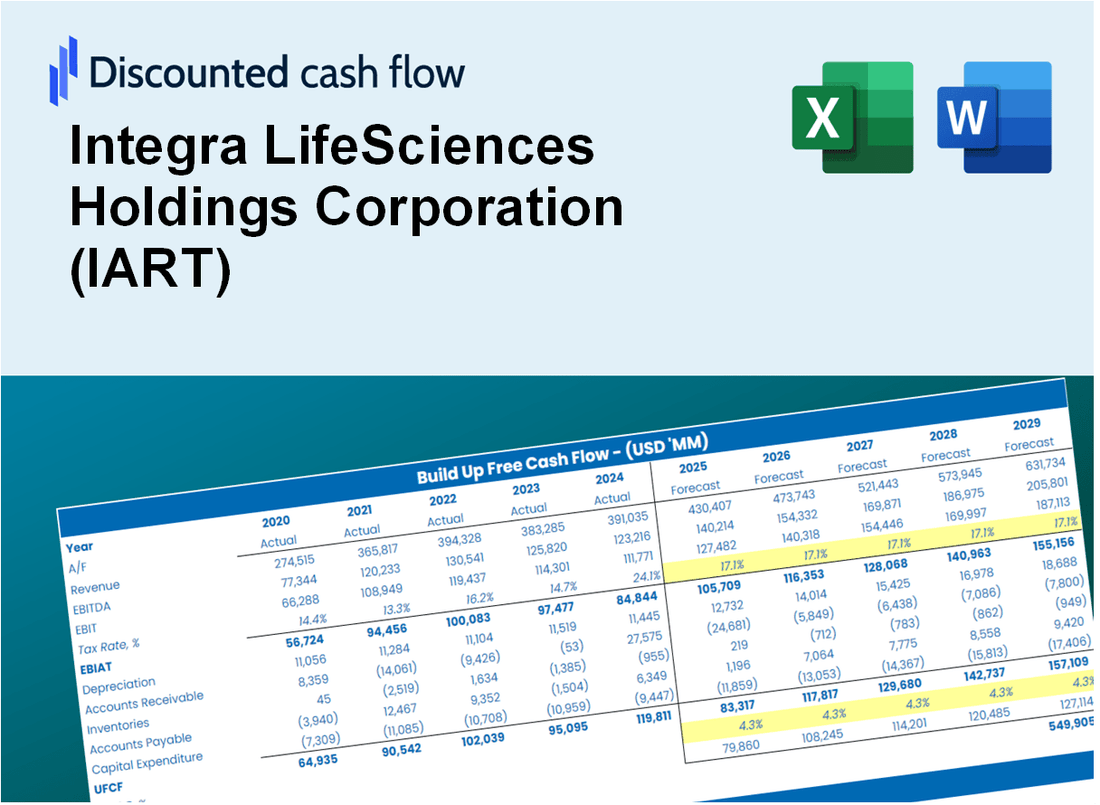
Unser (IART) DCF-Taschenrechner entwickelt für die Genauigkeit und ermöglicht es Ihnen, die Bewertung der Integra Lifesciences Holdings Corporation mithilfe realer Finanzdaten zu bewerten und bietet vollständige Flexibilität, um alle wesentlichen Parameter für verbesserte Projektionen zu ändern.
What You Will Get
- Real IART Financial Data: Pre-filled with Integra LifeSciences' historical and projected data for precise analysis.
- Fully Editable Template: Modify key inputs like revenue growth, WACC, and EBITDA % with ease.
- Automatic Calculations: See Integra LifeSciences' intrinsic value update instantly based on your changes.
- Professional Valuation Tool: Designed for investors, analysts, and consultants seeking accurate DCF results.
- User-Friendly Design: Simple structure and clear instructions for all experience levels.
Key Features
- Comprehensive Financial Data: Gain access to precise pre-loaded historical figures and future forecasts for Integra LifeSciences Holdings Corporation (IART).
- Tailored Forecast Inputs: Modify highlighted cells for key assumptions such as WACC, growth rates, and profit margins.
- Real-Time Calculations: Enjoy automatic updates to DCF, Net Present Value (NPV), and cash flow assessments.
- Interactive Dashboard: Utilize user-friendly charts and summaries to effectively visualize your valuation outcomes.
- Designed for All Users: An intuitive layout suitable for investors, CFOs, and consultants alike.
How It Works
- Step 1: Download the Excel file for Integra LifeSciences Holdings Corporation (IART).
- Step 2: Review the pre-filled financial data and forecasts specific to Integra LifeSciences.
- Step 3: Adjust key inputs such as revenue growth, WACC, and tax rates (highlighted cells).
- Step 4: Observe the DCF model update in real-time as you modify your assumptions.
- Step 5: Analyze the outputs and leverage the results for your investment strategies.
Why Choose This Calculator for Integra LifeSciences Holdings Corporation (IART)?
- Comprehensive Tool: Combines DCF, WACC, and financial ratio analyses tailored for (IART).
- Customizable Inputs: Modify yellow-highlighted cells to explore different scenarios for (IART).
- Detailed Insights: Automatically calculates the intrinsic value and Net Present Value specific to (IART).
- Preloaded Data: Access historical and forecasted data for (IART) to ensure accurate analysis.
- Professional Quality: Perfect for financial analysts, investors, and business consultants focusing on (IART).
Who Should Use This Product?
- Individual Investors: Make informed decisions about buying or selling Integra LifeSciences stock (IART).
- Financial Analysts: Streamline valuation processes with ready-to-use financial models for Integra LifeSciences (IART).
- Consultants: Deliver professional valuation insights to clients quickly and accurately regarding Integra LifeSciences (IART).
- Business Owners: Understand how large companies like Integra LifeSciences (IART) are valued to guide your own strategy.
- Finance Students: Learn valuation techniques using real-world data and scenarios related to Integra LifeSciences (IART).
What the Template Contains
- Pre-Filled DCF Model: Integra LifeSciences' financial data preloaded for immediate use.
- WACC Calculator: Detailed calculations for Weighted Average Cost of Capital.
- Financial Ratios: Evaluate Integra LifeSciences' profitability, leverage, and efficiency.
- Editable Inputs: Change assumptions such as growth, margins, and CAPEX to fit your scenarios.
- Financial Statements: Annual and quarterly reports to support detailed analysis.
- Interactive Dashboard: Easily visualize key valuation metrics and results.
Disclaimer
All information, articles, and product details provided on this website are for general informational and educational purposes only. We do not claim any ownership over, nor do we intend to infringe upon, any trademarks, copyrights, logos, brand names, or other intellectual property mentioned or depicted on this site. Such intellectual property remains the property of its respective owners, and any references here are made solely for identification or informational purposes, without implying any affiliation, endorsement, or partnership.
We make no representations or warranties, express or implied, regarding the accuracy, completeness, or suitability of any content or products presented. Nothing on this website should be construed as legal, tax, investment, financial, medical, or other professional advice. In addition, no part of this site—including articles or product references—constitutes a solicitation, recommendation, endorsement, advertisement, or offer to buy or sell any securities, franchises, or other financial instruments, particularly in jurisdictions where such activity would be unlawful.
All content is of a general nature and may not address the specific circumstances of any individual or entity. It is not a substitute for professional advice or services. Any actions you take based on the information provided here are strictly at your own risk. You accept full responsibility for any decisions or outcomes arising from your use of this website and agree to release us from any liability in connection with your use of, or reliance upon, the content or products found herein.